Manhattan Beach home prices have continued their unrelenting climb through 2018.
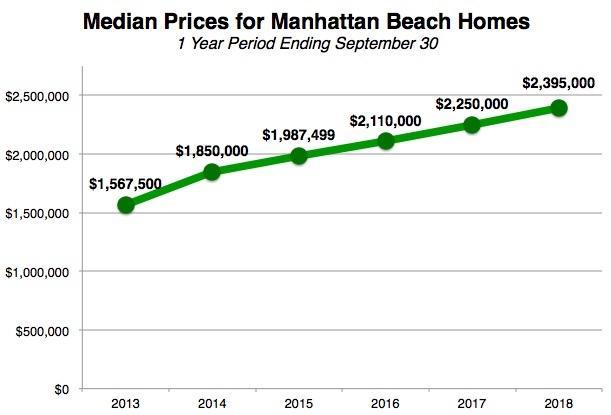 Our latest quarterly check-in on the Manhattan Beach median price finds another new high: $2,395,000.
We were startled to see the figure hit $2,349,000 for the full year of 2017, a jump of 13% over 2016. (See our post from Jan.…
Manhattan Beach home prices have continued their unrelenting climb through 2018.
Our latest quarterly check-in on the Manhattan Beach median price finds another new high: $2,395,000.
We were startled to see the figure hit $2,349,000 for the full year of 2017, a jump of 13% over 2016. (See our post from Jan. 2018 with that data; or this cover story featuring Dave's data in the Easy Reader.)
We were basically ready to see the median-price figure hit $2,370,000 at mid-year this year.
So what's another $25K anymore?
As our chart notes, every median-price figure we report compiles a full year's worth of data. Hence, the year-end 2017 median price captures all of 2017, while the mid-year data here in 2018 covered July 1-June 30 of each year.
Our latest chart covers Oct. 1-Sept. 30 to capture a full 12 months.
Now scratching at $2.4M, the Manhattan Beach median home price is (again) at its highest point ever.
If there's talk of a slowdown or weirdness in the market these days (there is), you have to base that largely on anecdotes. The data continue to portray a rising market.
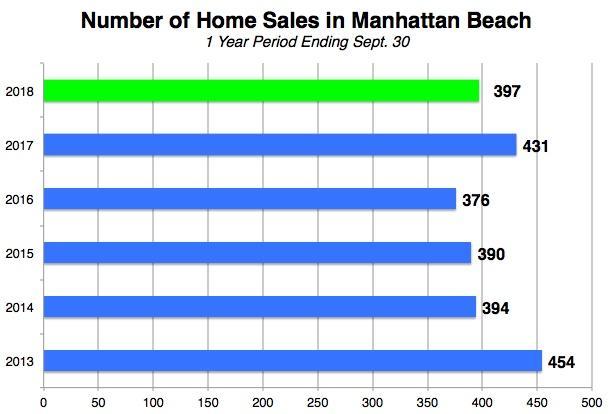 Where there is a slightly negative indicator, it is in the total number of sales of homes in Manhattan Beach.
Just last week we reported sales totals for Jan. 1-Sept. 30 for each of the past several years. (See our MB Market Update for 9/30/18.) We saw a dropoff in sales year-to-date this year compared to what we called "the sugar-high year of 2017," but otherwise strong numbers.
Exactly the same can be said of the 12-month data.
It was an 8% decline year-over-year from Jan. 1-Sept. 30, and it's an 8% decline year-over-year looking at Oct. 1-Sept. 30.
Looks like that extra dose of sugar in 2017 was worth an 8% boost in sales, eh?
Just as we said for the Q3 data last week, the sales total so far remains the second-best out of the past 5 years, so we're not exactly flopping around here in MB quite yet.
As a reminder, last week we found that Q3 2018 (July 1-Sept. 30) actually recorded more newly pending escrows than Q3 2017. So while actual, closed sales lag a bit, the pace of sales as measured by new deals is actually up here recently.
Please see our blog disclaimer.
Listings presented above are supplied via the MLS and are brokered by a variety of agents and firms, not Dave Fratello or Edge Real Estate Agency, unless so stated with the listing. Images and links to properties above lead to a full MLS display of information, including home details, lot size, all photos, and listing broker and agent information and contact information.
Based on information from California Regional Multiple Listing Service, Inc. as of July 26th, 2024 at 10:19pm PDT. This information is for your personal, non-commercial use and may not be used for any purpose other than to identify prospective properties you may be interested in purchasing. Display of MLS data is usually deemed reliable but is NOT guaranteed accurate by the MLS. Buyers are responsible for verifying the accuracy of all information and should investigate the data themselves or retain appropriate professionals. Information from sources other than the Listing Agent may have been included in the MLS data. Unless otherwise specified in writing, Broker/Agent has not and will not verify any information obtained from other sources. The Broker/Agent providing the information contained herein may or may not have been the Listing and/or Selling Agent.


