It was, at times, a bumpy year in Manhattan Beach real estate, but one statistic is going to define 2017.
The median price of homes sold in Manhattan Beach last year jumped 13% to $2,349,000.
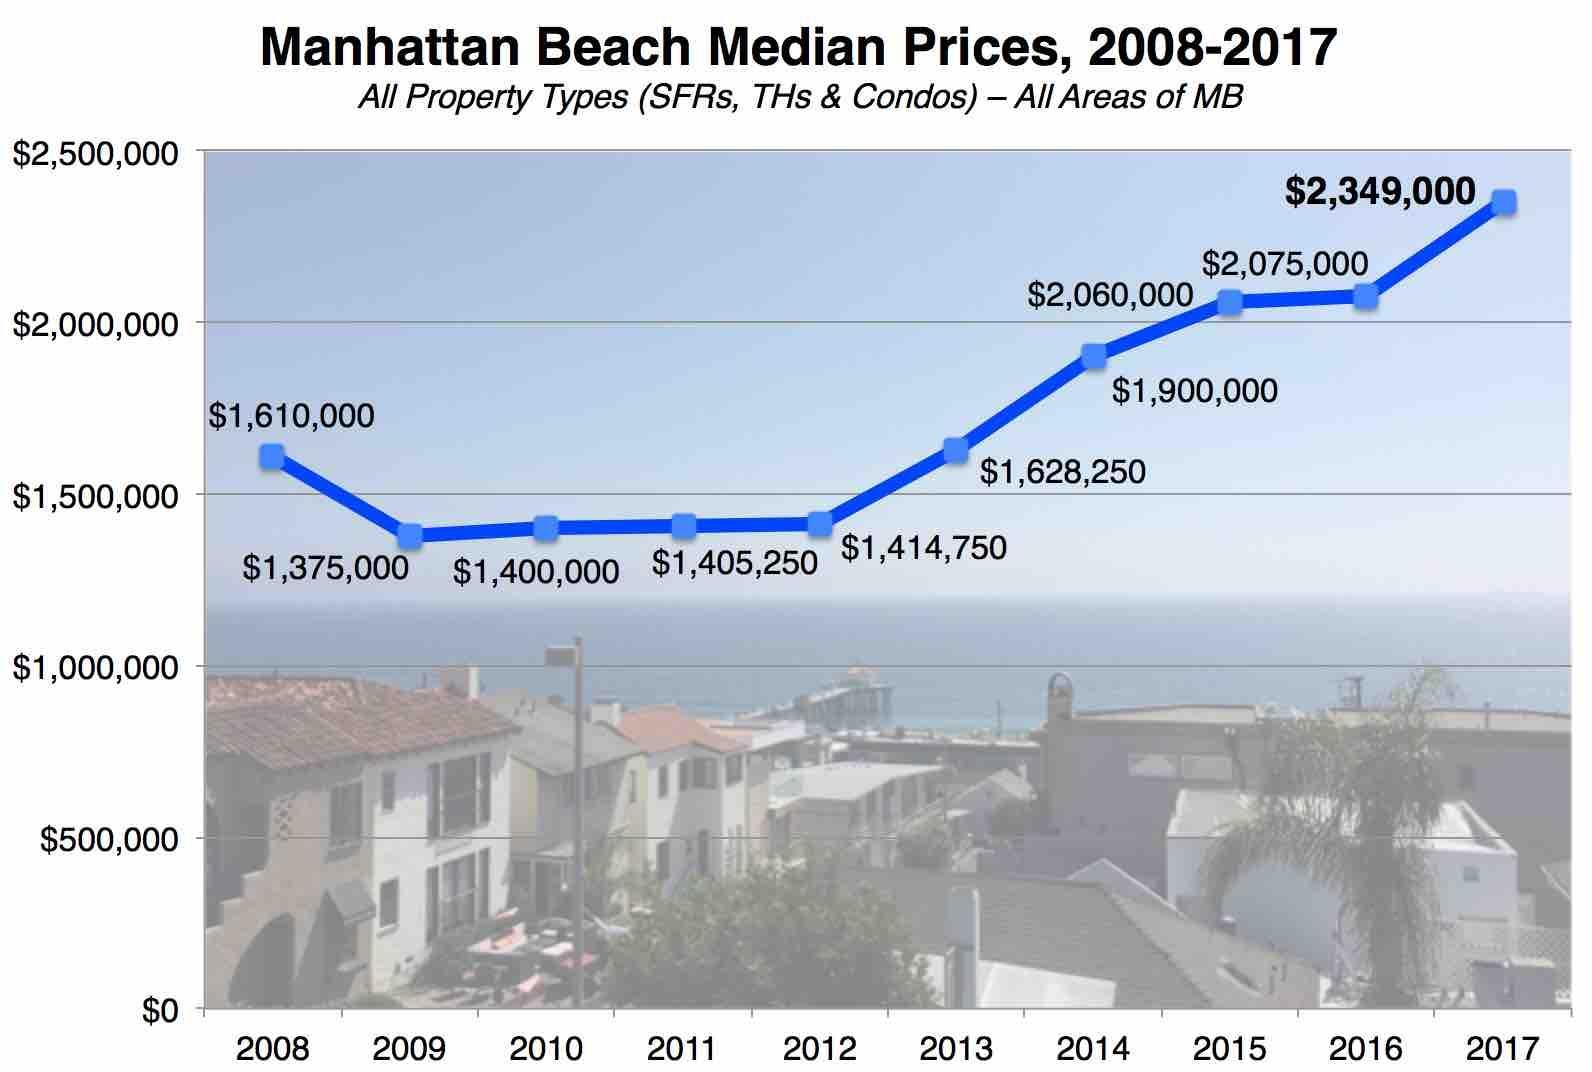
That's a head-snapping jump from 2016's $2,075,000, which had been only a little tick up from 2015's $2,060,000.…
It was, at times, a bumpy year in Manhattan Beach real estate, but one statistic is going to define 2017.
The median price of homes sold in Manhattan Beach last year jumped 13% to $2,349,000.
That's a head-snapping jump from 2016's $2,075,000, which had been only a little tick up from 2015's $2,060,000. Both those years were the first times Manhattan Beach's median home price was above $2 million.
If you didn't see that kind of big boost for 2017 coming, OK, but we actually gave some hints that this trend was developing throughout 2017.
In August, MBC posted first-half statistics indicating that prices were up 5% year-over-year. That data run compared July 1-June 30 of each of the past 5 years. (See "First Half '17 Bullish Again for Manhattan Beach.")
In December, we pointed out that sales East of Sepulveda above $3M were happening far more often than ever before. Before 2017, only 14 homes on "conventionally sized" lots had sold for more than $3M. During 2017, 15 more did, more than doubling the number of $3M+ sales. New construction was the driver. (See "Many More $3M+ Sales in East MB in 2017.")
We have also noted that the total number of home sales in Manhattan Beach in 2017 was higher than in any of the prior 3 years (2014-16). (See "Highest & Lowest Sales of 2017 in Manhattan Beach.")
Those were just some of the indicators that something big was afoot.
But still, 13%?!?!?!
 Wow.
Wow.
This 13% increase in the median price comes after a year of high inventory and calmer sales in 2016 that produced a bump of only 1% over 2015. Things were starting to level out, it seemed. Maybe 2017 would be flat, too? (That was our open question in our post about last year's sales, "2016 Saw Bounceback in Sales, Higher Median Price.")
We asked in that post, "So maybe we're leveling off now?"
No no no.
Folks, don't go into the prediction business. No profit in that.
The year-to-year increase in the median price for Manhattan Beach:
2012-2013: 15%
2013-2014: 17%
2014-2015: 8%
2015-2016: 1%
2016-2017: 13%
Was the Manhattan Beach real estate market all wine and chocolate and roses in 2017? Absolutely not.
Inventory ran high for most of the year, the Sand Section especially, and things got wobbly in spots.
The number of overbids and (related) the percentage of homes sold over asking price was down for the 4th straight year. Multiple offers didn't always result in higher prices. (See "Pace of Overbids Slows, Market Cools.")
Yeah, we can try to give you all the mitigating factors, itemize some causes for concern, speculate about trends in the market that may or may not continue into 2018.
But that would sound like white noise. No one will hear it.
The median price rose 13%. There were 210 homes sold (out of 421) for more than $2,349,000.
That's the most ever, of course, 51 more than last year, and more than triple the number sold over $2.349M in 2012.
Boom, Manhattan Beach! You had a great year!
------------------------------------------
BONUS READING: We have a dedicated page about Manhattan Beach median home prices. You can see today's stats along with links to past posts and updates.
Please see our blog disclaimer.
Listings presented above are supplied via the MLS and are brokered by a variety of agents and firms, not Dave Fratello or Edge Real Estate Agency, unless so stated with the listing. Images and links to properties above lead to a full MLS display of information, including home details, lot size, all photos, and listing broker and agent information and contact information.


