If you think back to early 2012, it wasn't so long ago, really.
But that was probably the beginning of the current rally in Manhattan Beach real estate, with prices now riding a "rocket to the moon," as we said in a recent post. (See "MB Median Prices Tilt Way Up.") Today, the world looks quite a bit…
If you think back to early 2012, it wasn't so long ago, really.
But that was probably the beginning of the current rally in Manhattan Beach real estate, with prices now riding a "rocket to the moon," as we said in a recent post. (See "MB Median Prices Tilt Way Up.") Today, the world looks quite a bit different.
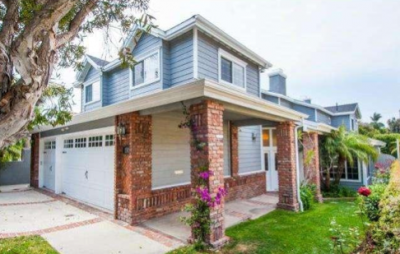 One of the first homes to sell in our real estate "Spring" that year (our Spring market begins around Feb. 1) was 1305 8th (6br/4ba, 4100 sq. ft.).
It listed for $1.725M, and we recall thinking something like "nice place, cosmetic fixer, but is that kind of rich?" It sold almost immediately for only a little less: $1.710M.
That sale seems now to have been one of the first signs of the market to come: Solidifying, more confident, with prices quickly nearing those of the previous bubble years.
That was about 2 1/2 years ago, and 1305 8th has just resold. (It's newly in escrow.)
This year's list price of $2.100M was in line with similar sales – this particular floorplan is prevalent all around MB and there are dead-on comps to look at.
That list price was a markup of 19% over acquisition, call it $400K.
The funny thing is that some may look at that now and say 19% over 28 months or so is just not good enough.
There's something of a meme out there in the discussion of Manhattan Beach real estate prices, that we're rising 1% each month. So 28 months should be 28%, and the price (by this rough calculus) should be more like $2.200M. (Hey, maybe it is – we don't know what the accepted offer is at!)
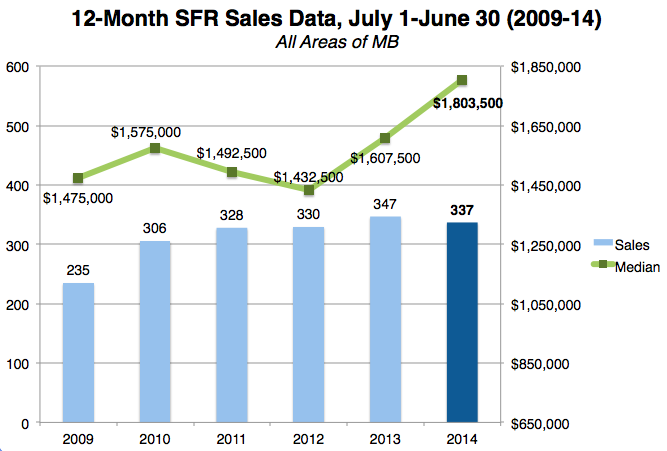 In our recent rundown on median prices, we did see that the median price for SFRs in MB as of June 30, 2014, compared to June 30, 2012, was up 26%.
However, you can see some quirks in the data, as both the 2010 and 2011 median prices were higher than 2012, so the jump from 3 years or 4 years was – paradoxically – not as sharp.
Ultimately, no one prices based on charts, they price based on the house and condition and location. Your results may vary.
For instance, the modern TH at 424 Marine Place sold for $1.370M in Jan. 2013, and just resold for $1.765M, a bump of 29% in about 18 months. They caught the wind in their sails there, didn't they?
Please see our blog disclaimer.
Listings presented above are supplied via the MLS and are brokered by a variety of agents and firms, not Dave Fratello or Edge Real Estate Agency, unless so stated with the listing. Images and links to properties above lead to a full MLS display of information, including home details, lot size, all photos, and listing broker and agent information and contact information.
Based on information from California Regional Multiple Listing Service, Inc. as of May 4th, 2024 at 4:55pm PDT. This information is for your personal, non-commercial use and may not be used for any purpose other than to identify prospective properties you may be interested in purchasing. Display of MLS data is usually deemed reliable but is NOT guaranteed accurate by the MLS. Buyers are responsible for verifying the accuracy of all information and should investigate the data themselves or retain appropriate professionals. Information from sources other than the Listing Agent may have been included in the MLS data. Unless otherwise specified in writing, Broker/Agent has not and will not verify any information obtained from other sources. The Broker/Agent providing the information contained herein may or may not have been the Listing and/or Selling Agent.


