We recently looked at the changing market for Manhattan Beach townhomes through the lens of just one recent deal. (See "How the Townhome Market Has Changed.")
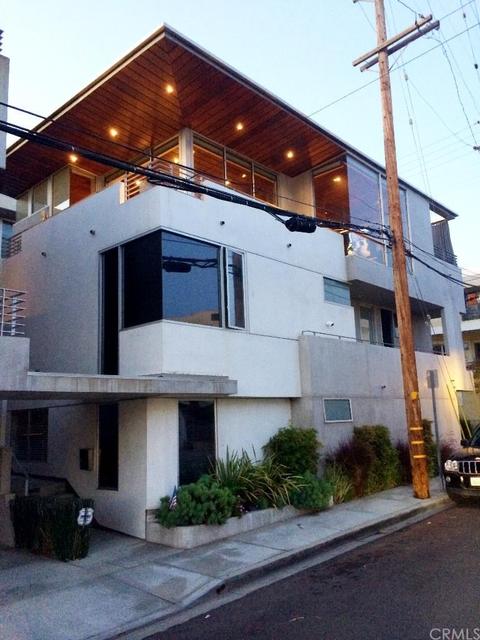
 That one deal was for 2301 Vista, a modern-style 3br TH with 2400+ interior square feet that's in escrow after listing about 75% higher than its 2011…
We recently looked at the changing market for Manhattan Beach townhomes through the lens of just one recent deal. (See "How the Townhome Market Has Changed.")
 That one deal was for 2301 Vista, a modern-style 3br TH with 2400+ interior square feet that's in escrow after listing about 75% higher than its 2011 purchase price.
But we also like to get away from anecdotes and look at a bit more data.
This time we're trying to get at two questions:
What's a typical price per square foot (PPSF) for a Sand Section townhome now?
What's are the recent trends?
To compare apples to apples, we looked at sales from the first half of each of the past 5 years. That is, Jan. 1-Jan. 30 of each year only (2011-2015).
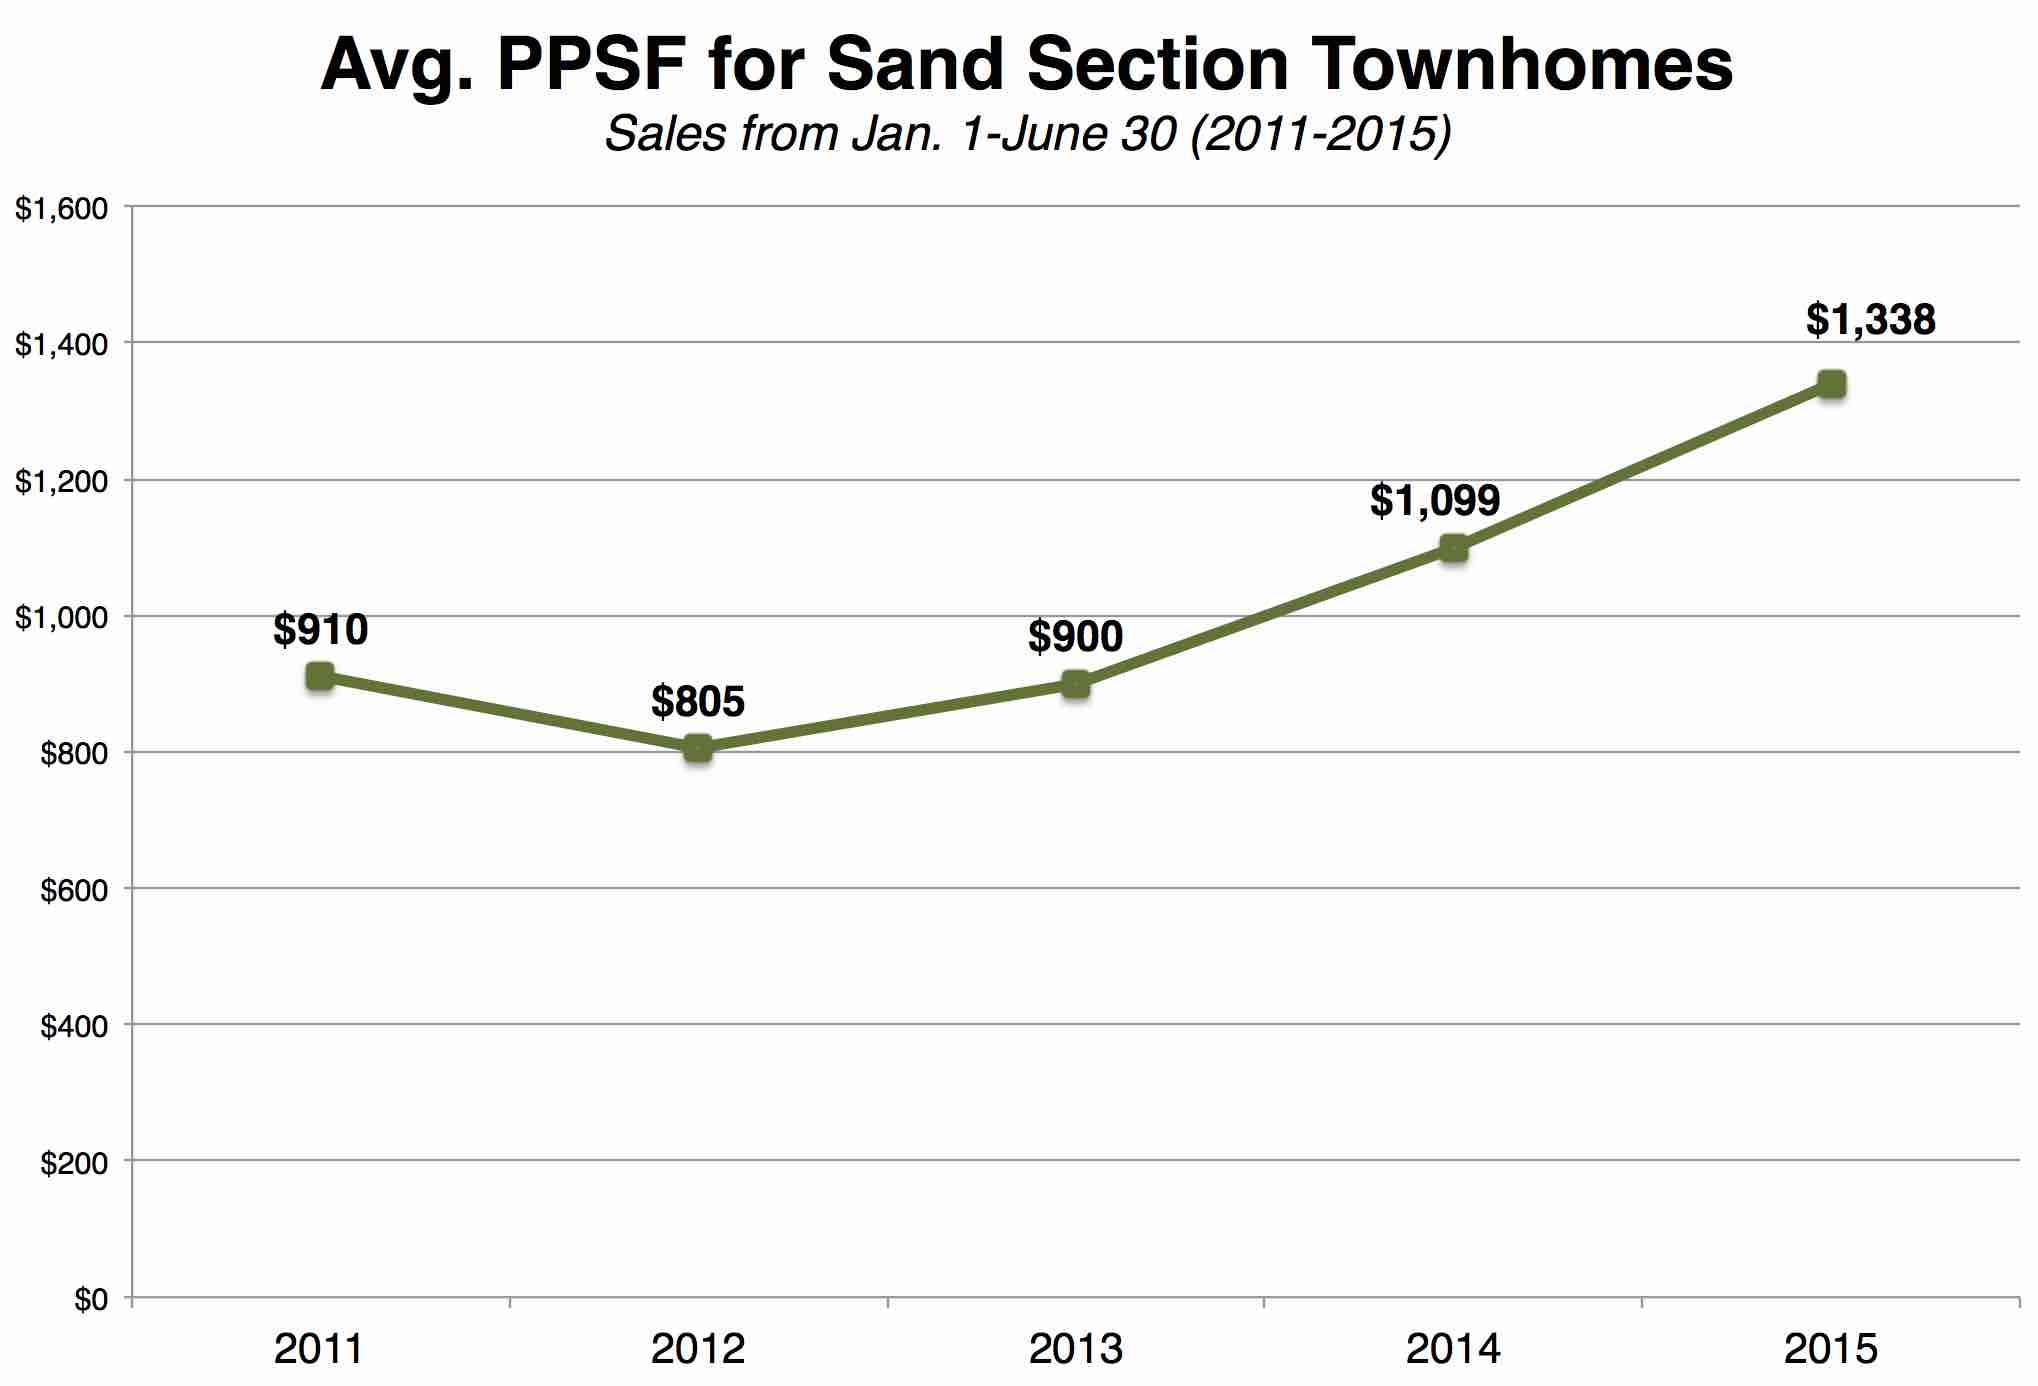
 As you'll see here in our chart, the uptrend is 3 years old now, with the average PPSF of Sand Section townhomes at $1,338/PSF this year.
That's a rocking 22% over the average townhome PPSF just last year. (The 2014 figure was $1,099/PSF.)
But that trend is familiar. Because 2014's average PPSF was also 22% over the prior year, 2013. (The jump was $900 to $1099/PSF.)
As you see in our chart, the 2011 and 2013 figures were pretty close, with a dip in 2012 right between.
(That 2012 dip, which maybe feels like an anomaly, is seen in other areas, too – for instance, in median prices for SFRs in MB, which were [strangely] higher in 2010 than in 2011 or 2012. [See "How Prices Have Bounced Since '09."])
Now, the bump in PPSF for Sand Section townhomes is coming out of higher prices in general. That's a trend we've been watching for some time.
And here the retail prices are rising faster than even the PPSF can tell us.
Gone are the days of $1.7M ocean-view townhomes. (Those days weren't so very long ago.)
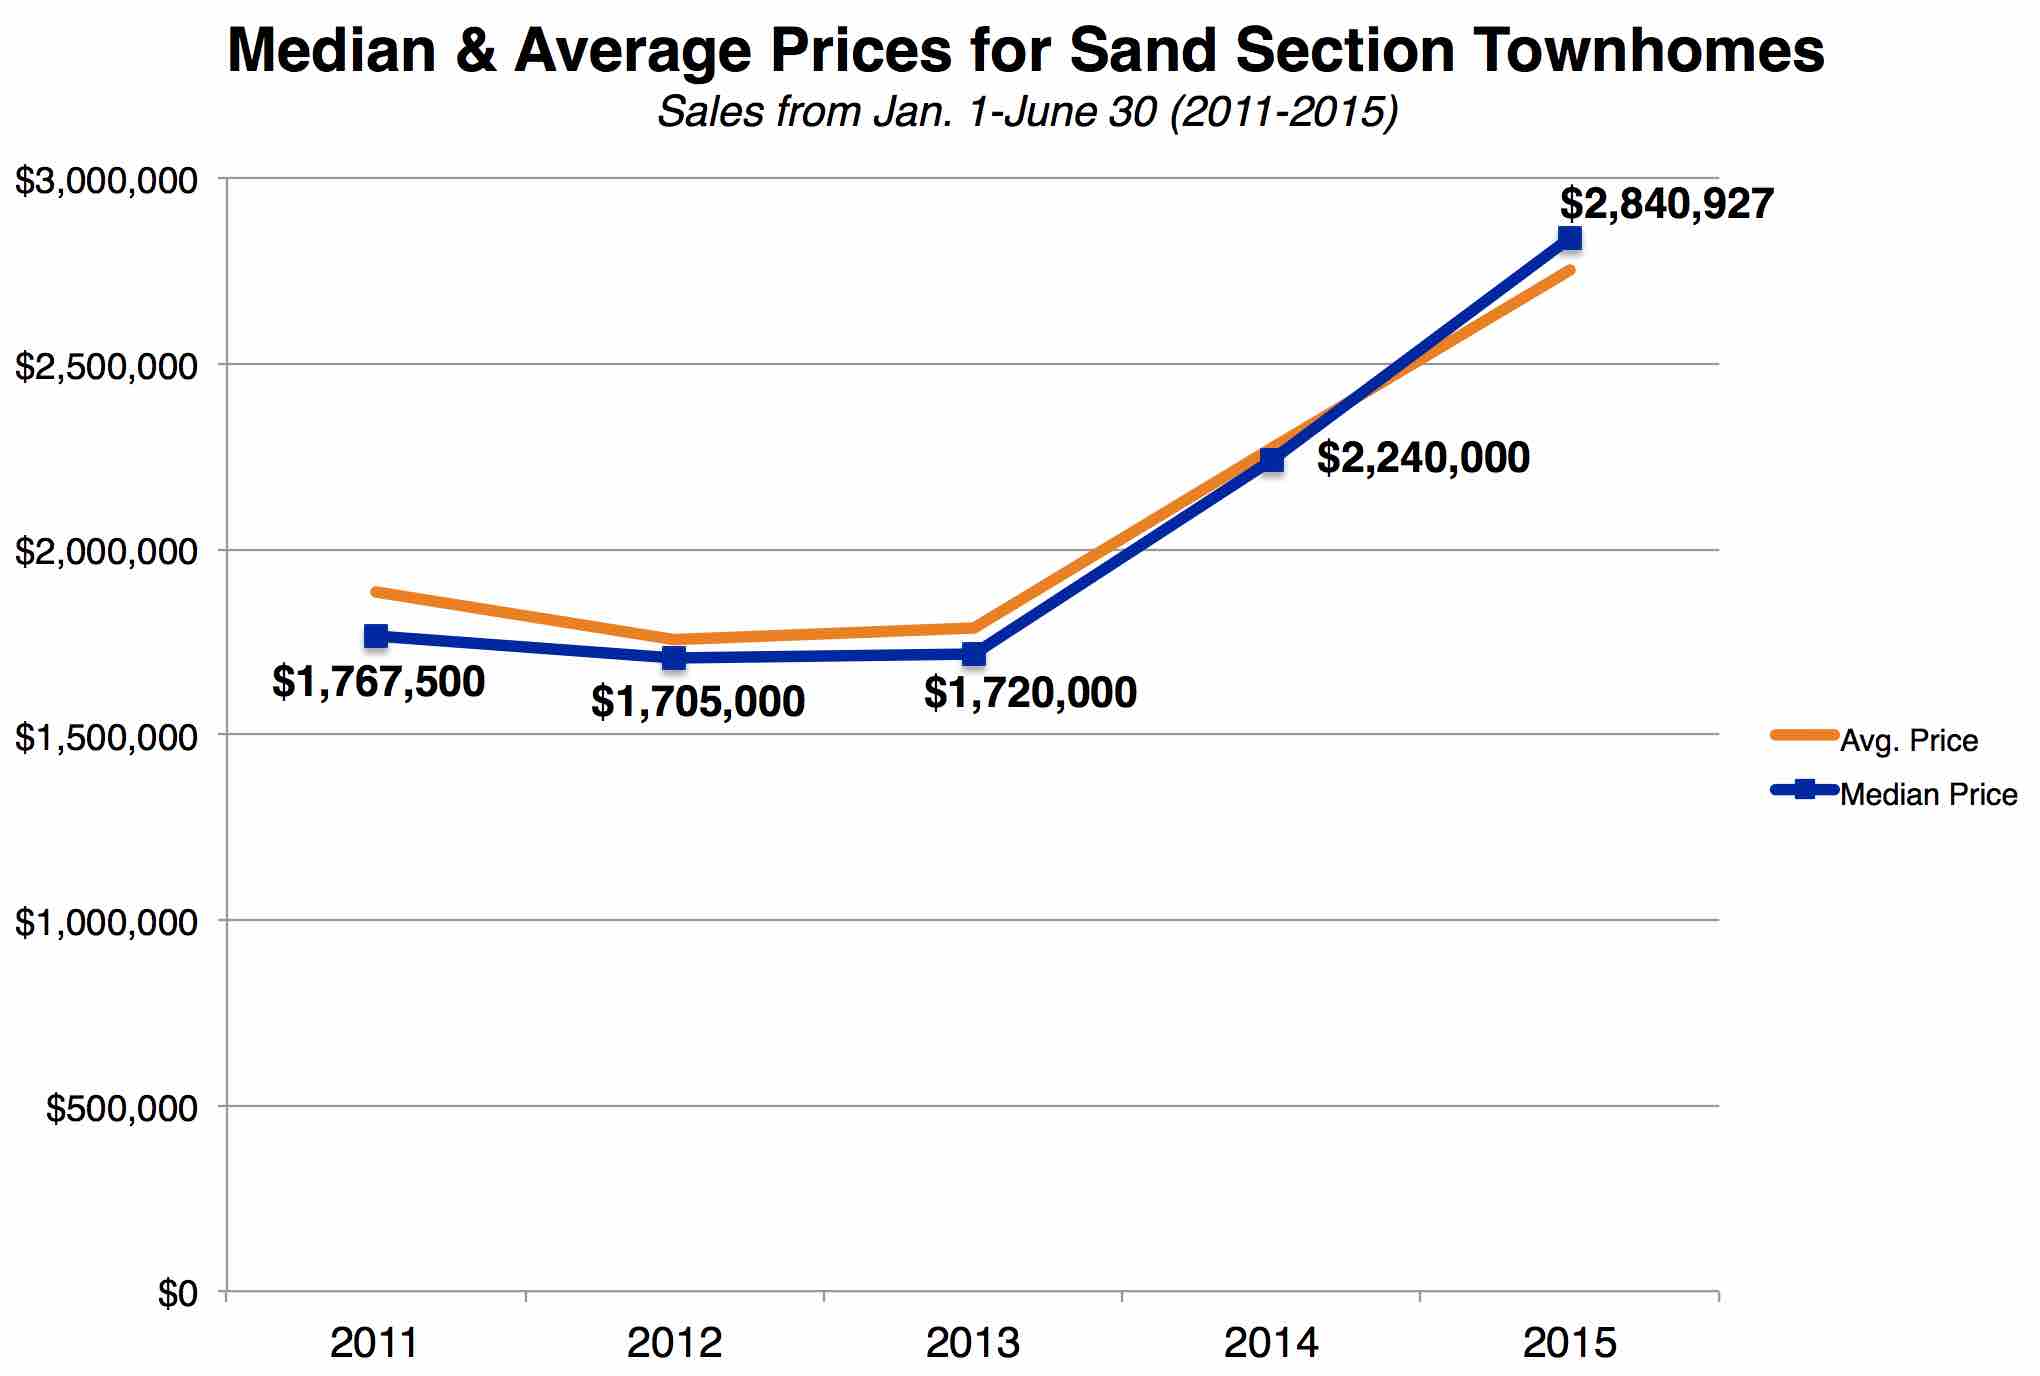
 Here is a quick look at both the average and median prices for Sand Section townhomes sold during this same first-half period of each of the past 5 years.
The jump is even more pronounced here, with $1.7-ish prices lingering until last year, when the rocket ship took off.
You see a $1.1M price difference in just 2 years for the same types of properties, a breathtaking jump of 65% in sale prices in the space of 24-30 months.
Wow.
You'll note that we included both median prices and average prices here. Typically we have no place for "average" prices, which can be useless for describing a real estate market like ours. However, with a subset of properties like "sand section townhomes," the average price seems to show a decent correlation between average and the preferred – but also flawed – measure, median prices. That's worth noting.
We should give you a couple more quick caveats to our data. We did drop out from the data set a few sales that just didn't fit. For instance, short sales and REOs. There weren't a lot, but distress sales tend to queer the data, so we kept those out.
Also, a couple of Strand properties and tiny, decrepit properties were in the mix. Those cases were so vastly different from the mainstream data we were seeing, we dropped them out. The idea was to make this data set we're looking at as close to uniform as possible, even with different building ages, condition, etc.
To that point about the relative similarity of the homes in the dataset: For each of the 5 years we looked at (first half only), the average interior square footage was quite consistent: Around 2000-2100 sqft.
The takeaways:
- PPSF for Sand Section townhomes is up 22% from last year, up 47% since 2011
- Sand Section townhome prices are up 65% since 2013
See the most recent Sand Section TH sales for yourself below or (for email subscribers) by using this link.
Please see our blog disclaimer.
Listings presented above are supplied via the MLS and are brokered by a variety of agents and firms, not Dave Fratello or Edge Real Estate Agency, unless so stated with the listing. Images and links to properties above lead to a full MLS display of information, including home details, lot size, all photos, and listing broker and agent information and contact information.

 That one deal was for 2301 Vista, a modern-style 3br TH with 2400+ interior square feet that's in escrow after listing about 75% higher than its 2011…
 As you'll see here in our chart, the uptrend is 3 years old now, with the average PPSF of Sand Section townhomes at $1,338/PSF this year.
 Here is a quick look at both the average and median prices for Sand Section townhomes sold during this same first-half period of each of the past 5 years.