Sales of SFRs in Manhattan Beach in 2007 were off 34% from the roaring pace of 2003, and down 43% from the peak year of 2002.
As our first graph here shows (click any graph to enlarge), sales totals have declined nearly 10% each year since 2003, with 2007's sales total of 344 the lowest of this decade. The drop…
Sales of SFRs in Manhattan Beach in 2007 were off 34% from the roaring pace of 2003, and down 43% from the peak year of 2002.
As our first graph here shows
(click any graph to enlarge), sales totals have declined nearly 10% each year since 2003, with 2007's sales total of
344 the lowest of this decade. The drop year-over-year from 2006 to 2007 was exactly 10%.
As it happens, the first half of 2007 began a bit better than 2006, with 216 sales compared to 205 in the first 6 months of the prior year. But in the second half, sales slumped to 128, or
50 fewer than the same period in 2006.


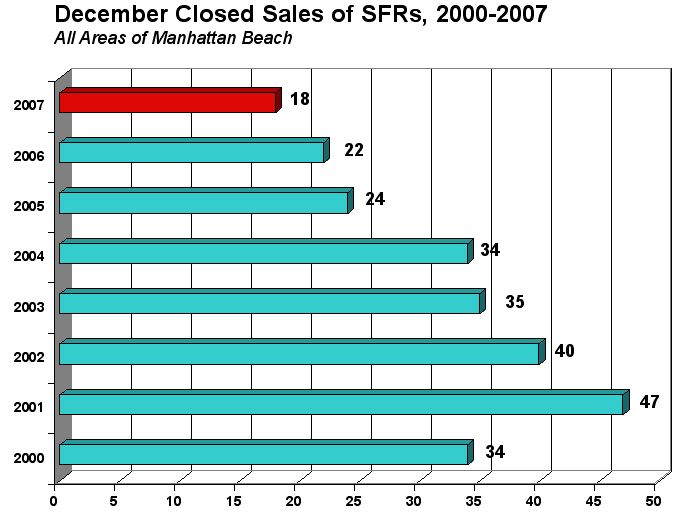
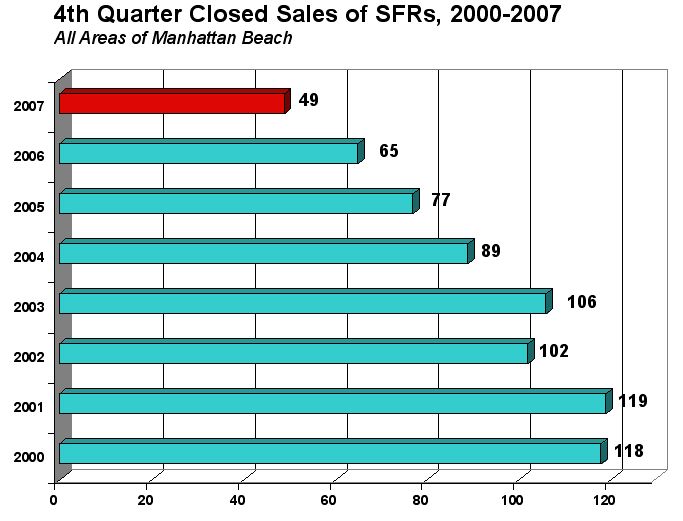
Our other graphs show that December 2007 was the worst of the decade, which somehow hardly seems a surprise. The fourth quarter, which consisted of sales consummated after the mortgage/credit meltdown began in August, showed marked deterioration, with the sales pace off 50% or more from the 2000-2004 totals, and down 25% from 2006.
Is this a slump? In the limited context of this booming (and young) century, it is. And the trends year-over-year seem unmistakable. (A fuller answer would require data from the end of the last down cycle up through the resurgence that was obviously well under way by 2000.)
There is room for continued deceleration in sales next year. The sales total of 344 averages out to 28 sales per month across the year. MB exceeded that level in each of the first 6 months of 2007, and again in August, but the average for the second half of 2007 was just 21 sales per month. That's a substantial drop from the monthly average of 30 sales seen in the second halves of both 2005 and 2006. If a 4th-quarter hangover depresses first-half sales in 2008, the year could really prove a bummer.
We should give credit where it's due. This data comes to us by way of Kaye Thomas' blog, where she has been posting local sales data consistently over time.
(Thanks, Kaye!) [Click
here for her story with the data set; or here for
Kaye's front page.]
MBC simply repackaged and graphed her numbers, which come from MLS data.
Note: The data in these graphs and this story cover all SFRs in MB, which means that sales east of Sepulveda are part of the set. (Click here to download the
raw data in a 1-pg. PDF.)
It must be mentioned that MB's sales slowdown, while undeniable, was not as bad in December as the overall trends for Southern California or LA County, as
reported by Dataquick the other day.
(Click for Dataquick's press release, which features the words and phrases "nose-dive," "remarkably low level of home sales" and "by far the lowest for any December in Dataquick's statistics, which go back to 1988.")According to DQ, December sales were:
- LA County: -47.8% year-over-year
- SoCal: -45% year-over-year
If we dare to calculate the year-over-year figure for one month, 18 sales this past December compared to 22 in Dec. 2006, that's a drop of
18%. Of course, the tiny sample size limits the value of one-month figures. Looking at the graph of December data, you can almost view December sales in 2005-2007 as equivalent, even though 2007 was the slowest.
Overall, these data convincingly describe a
slowing market. However, inventories were lower in MB in 2007 than in 2006 – and presumably lower than in recent years with higher sales – and our local median price held up nicely in 2007. So what's in store for 2008?
Please see our blog disclaimer.
Listings presented above are supplied via the MLS and are brokered by a variety of agents and firms, not Dave Fratello or Edge Real Estate Agency, unless so stated with the listing. Images and links to properties above lead to a full MLS display of information, including home details, lot size, all photos, and listing broker and agent information and contact information.