Last week, MBC gave a very detailed view of sales data from the past 3 years, comparing the periods ending in May with 3-month, 5-month and 12-month lookbacks. (See "Recent Sales Trends in MB.")

We did something similar, though less exhaustive, for the most recent South Bay Confidential column for the Daily…
Last week, MBC gave a very detailed view of sales data from the past 3 years, comparing the periods ending in May with 3-month, 5-month and 12-month lookbacks. (See "
Recent Sales Trends in MB.")
We did something similar, though less exhaustive, for the most recent South Bay Confidential column for the Daily Breeze.
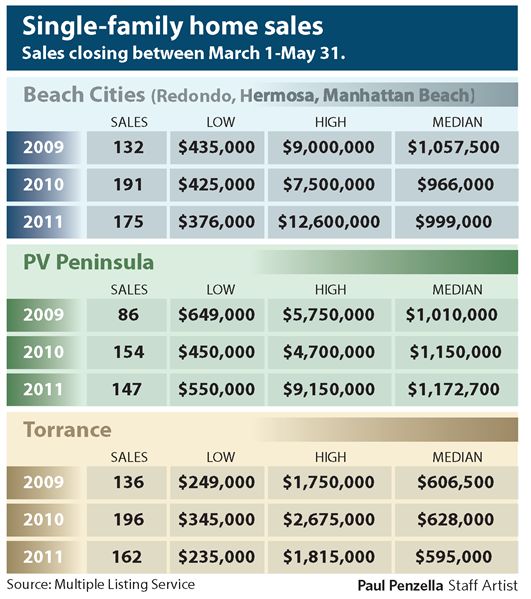
This chart summarizes the data, and
by linking here to the column, you can see the writeup. (Click chart to enlarge.)
Since no more than 15% of readers will click on that link (we're guessing), here are the Cliff's notes.
For each calculation, we looked
only at the 3-month period ending in May (March 1-May 31).
YOY SalesBeach Cities (HB, RB, MB): # sales down 2%, median price +3%
PV Peninsula: # sales down 2%, median price +2%
Torrance: # sales down 17%, median price -5%
Compare those figures to what we had last week for MB:
West of Sepulveda: sales down by 4, median price 0% change
All MB areas: sales down by 3, median price -1%
Other Data PointsLooking back 2 years, PV had a pretty startling recovery in total sales, up 71% compared with 2009. That year was the one that saw PV take a hit, though the region has been strong during most of the period that surrounding areas were most affected by the popping bubble.
It was the only South Bay region we looked at that now has a higher median price than 2009 for this 3- month period.
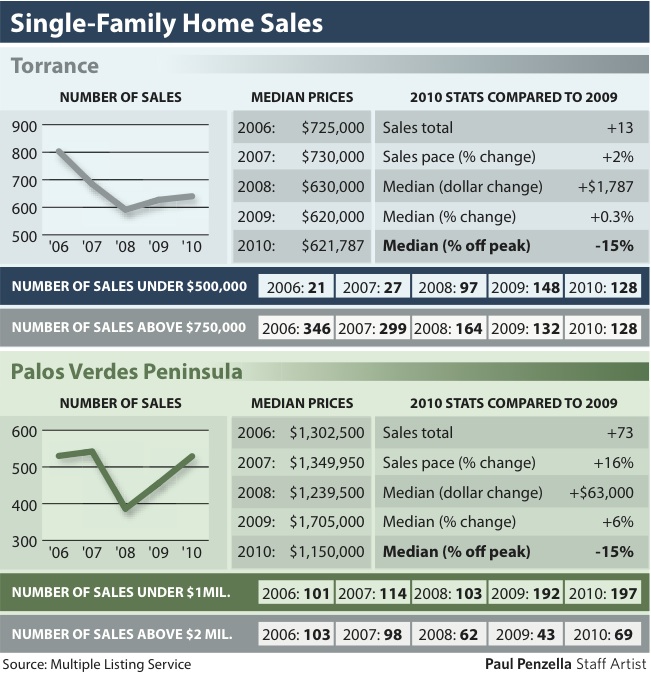
Torrance is a big market that has been steaming along nicely the past few years, once prices came down. As this chart (courtesy of a past
Daily Breeze column) shows, for the period 2008-2010, full-year data on sales and median prices have been steady and consistent.
The dropoff in sales volume this Spring in Torrance is a significant surprise and more of a warning sign than even the 5% drop in prices.
Again looking only at the 3-month period, MB had a median price down 1% from 2009
when studied by itself. The whole of the Beach Cities region fared a bit worse, with the median price down 5% from '09.
Please see our blog disclaimer.
Listings presented above are supplied via the MLS and are brokered by a variety of agents and firms, not Dave Fratello or Edge Real Estate Agency, unless so stated with the listing. Images and links to properties above lead to a full MLS display of information, including home details, lot size, all photos, and listing broker and agent information and contact information.
Based on information from California Regional Multiple Listing Service, Inc. as of May 21st, 2024 at 9:55am PDT. This information is for your personal, non-commercial use and may not be used for any purpose other than to identify prospective properties you may be interested in purchasing. Display of MLS data is usually deemed reliable but is NOT guaranteed accurate by the MLS. Buyers are responsible for verifying the accuracy of all information and should investigate the data themselves or retain appropriate professionals. Information from sources other than the Listing Agent may have been included in the MLS data. Unless otherwise specified in writing, Broker/Agent has not and will not verify any information obtained from other sources. The Broker/Agent providing the information contained herein may or may not have been the Listing and/or Selling Agent.