For the 3-month period ending today, Aug. 31, there have been
25% more new SFR listings west of Sepulveda than in the same June-August period last year.
(Click graphic to enlarge.)But August 2010 has seen just one more new listing – as of early afternoon on the month's last day – than Aug. 2009.
The boost from…
For the 3-month period ending today, Aug. 31, there have been
25% more new SFR listings west of Sepulveda than in the same June-August period last year.
(Click graphic to enlarge.)But August 2010 has seen just one more new listing – as of early afternoon on the month's last day – than Aug. 2009.
The boost from Summer 2009 to this Summer tells you something about a change in the mood of sellers.
Last year, the mood was grim, for a reason – the Fall 2008 financial market meltdown had its impact on the local RE market over the ensuing several months. There were deals and hard bargains driven in early 2009, but lots of buyers were spooked, and money was hard to come by, regardless.
Why list your house then if you didn't absolutely have to?
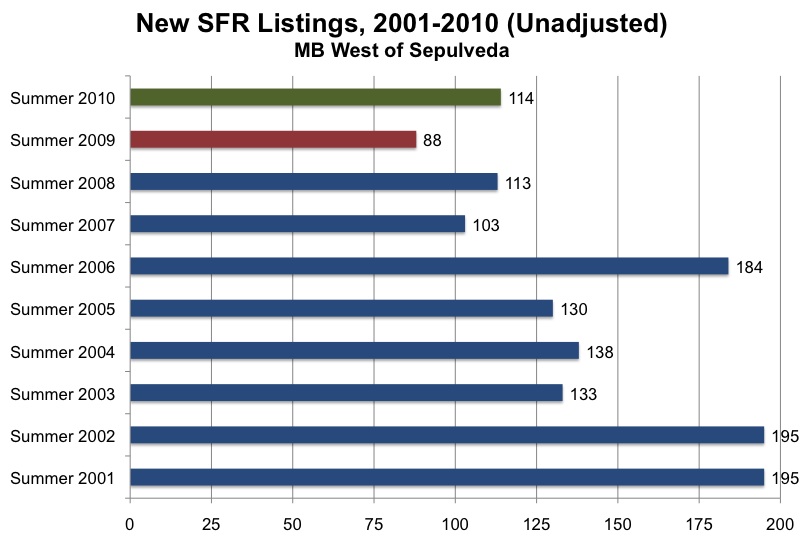
Potential sellers placed the fewest homes on the market in Summer 2009 out of any Summer of the previous 10 years (2001-2009, inclusive).
(See second graph below.)By Spring 2010, as we've documented in detail here at MBC, buyers' moods had shifted, local housing inventory was low and, suddenly, deals were happening quickly – the phrase "multiple offers" even made a comeback.
Cue the next round of sellers. This Summer's crop of listings reflects a group of sellers well aware of the bounce earlier this year. Data seem to confirm the sense we've heard anecdotally from some sellers before dipping their toes into this market:
This is an OK time to sell, right?Despite the rise over last year, this Summer's inventory bounce makes 2010 look pretty average. Our look at 11 years' worth of data here
(click graph to enlarge) shows that Summer 2010 saw about the same number of new listings hit during the 3 months of Summer that were seen in 2007 and 2008. This year's total isn't far off some of the mid-bubble years (2003-05), lagging those years by just 12-15%.
An interlude for nerdy notes: For all of this data, we're relying on MLS records of homes listed for sale with a start date in the subject period. (Aug. 1-Aug. 31 for our 2009-2010 comparison; between June 1-Aug. 31 of the year in question for all the other Summer-to-Summer comparisons.)
Also, be aware that, for only the 2009-2010 comparisons (first graph), we've manually stricken several records from the total count because the homes were merely
re-listed during the August or Summer in question; the original listings had begun earlier. We cut 10 from the Summer 2010 total and 5 from 2009. To present the full 2001-2010 data, it was not practical to make those deletions, so we're presenting the "raw," unadjusted counts for each year.
OK, end nerdy notes.It's always interesting to see the bigger picture.
The Summers of 2001, 2002 and 2006 were gigantic for new inventory. In 2001-02, with 195 new listings in each Summer, there were 70% more public offerings of homes for sale than we saw this year. That meant lots more choices at a time when optimism was first really dawning and prices were beginning a steep climb.
Despite the fairly good numbers this year, you'd be hard-pressed to find someone who believes we're at the starting end of a major new upcycle like we had ahead of us then.
As we look in the rear-view mirror now, you can understand a big part of why Summer/Fall 2006 wound up with a big inventory overhang and the first strange, post-bubble market locally. There were far too many sellers trying the market right then, as if the bubble were inflating instead of nearing a 3-year deflationary period.
Looking again at August 2009, we note that 18 of the 20 listings that first came to the public in that month were eventually sold. That's not a bad record for the August 2010 crop to shoot for.
Please see our blog disclaimer.
Listings presented above are supplied via the MLS and are brokered by a variety of agents and firms, not Dave Fratello or Edge Real Estate Agency, unless so stated with the listing. Images and links to properties above lead to a full MLS display of information, including home details, lot size, all photos, and listing broker and agent information and contact information.