We had not yet published YTD sales date for the first half of 2011, and now we can.
In short: Prices in MB are down a bit this year compared to 2010, on somewhat higher sales.
The story takes on a couple of wrinkles after that as we look at MB west of Sepulveda and all of MB separately.
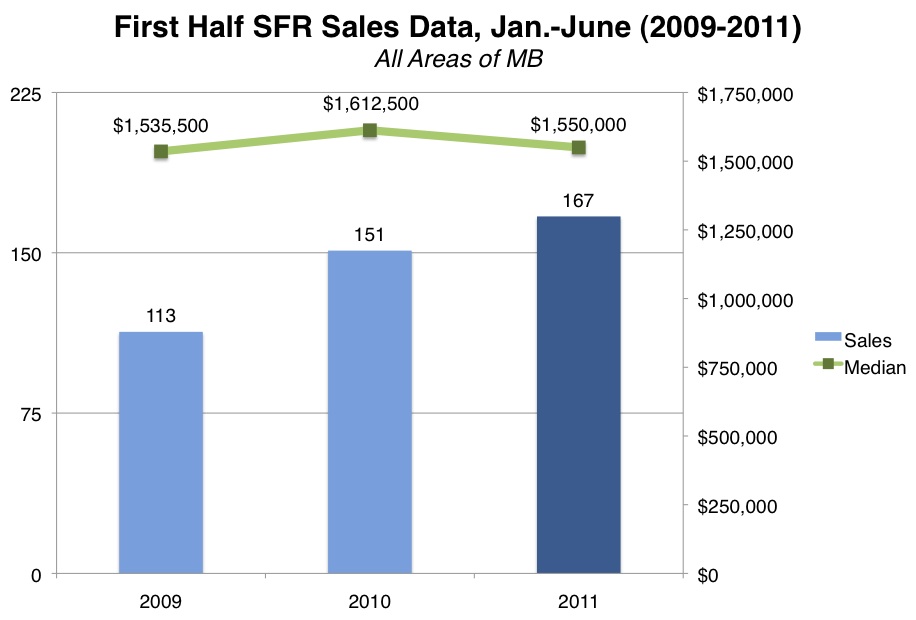
 All of MB
It's remarkable, at…
We had not yet published YTD sales date for the first half of 2011, and now we can.
In short: Prices in MB are down a bit this year compared to 2010, on somewhat higher sales.
The story takes on a couple of wrinkles after that as we look at MB west of Sepulveda and all of MB separately.
All of MBIt's remarkable, at first blush, to see median prices in 2011 hovering very close to 2009 levels.
Citywide, the improvement in the median price 2 years after the trough of 2009 is less than a full 1%. Another way of saying that is that MB is flat to 2009 prices.
By contrast, the median price's year-over-year improvement from the first half of 2009 to the first half of 2010 had been 5%.
Sunny days. We've now given up 4%.
Whatever the median prices, it's got to be encouraging to see the number of sales trending consistently up. The uptick in closings Jan. 1-June 30 is almost 11% year-over-year to 2010, while 2011's
167 sales is a 48% improvement over the doldrums of '09.
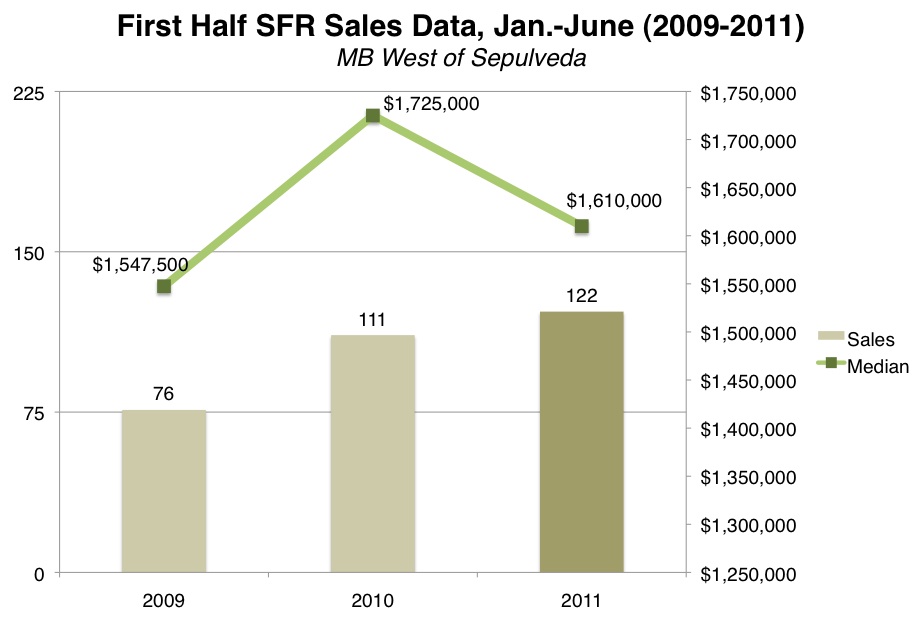
West of SepulvedaAs with the city as a whole, you see somewhat more sales west of the highway in 2011 than were seen in the first half of 2010.
The
122 sales from Jan.-June this year was stunning 60% more than the 76 seen in the same period as the local market's brakes were fully engaged in 2009.
Last year, the median price for the first half made a big leap from $1.547m to $1.725m (+11%). This year, the median cascaded almost 7% west of Sepulveda, but you're going to have to draw your own conclusion about how we rose so high last year or fell so far this year. Maybe 100 or so sales is still too small a sample size.
The current median price WoS, at
$1.610m, is up 4% from that very difficult year of 2009. Not quite as flat as MB overall at +1%.
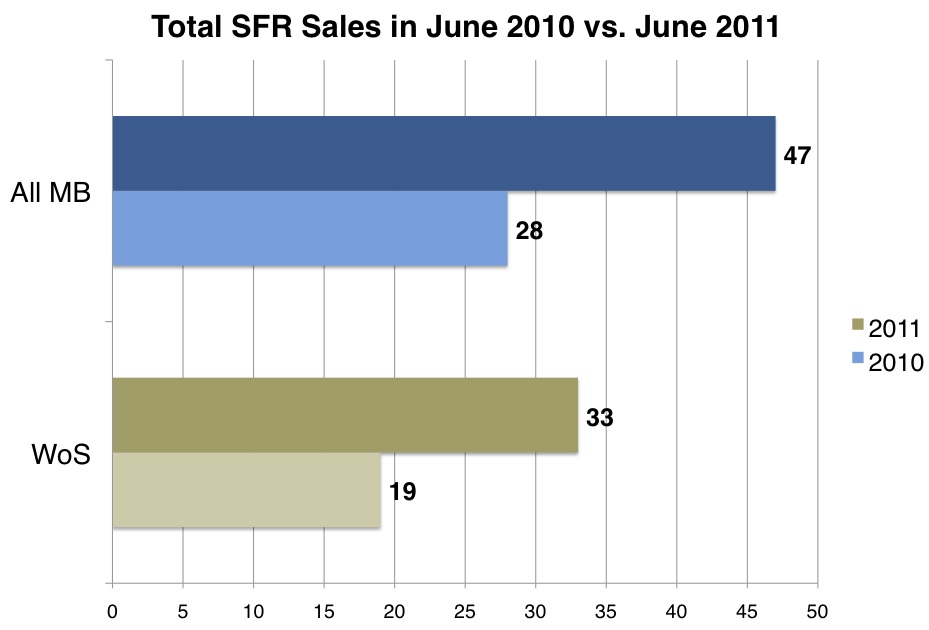
Reason for optimism: These figures look a little different from those we reported for YTD sales as of the end of May. (See "
Recent Sales Trends in MB.") Then, 2011 sales both west of the highway and citywide lagged very slightly behind 2010 sales.
Now that we see the complete first half exceeding sales figures for 2010 by either measure, the obvious inference is that June 2011 sales were much better than June 2010 sales. Turns out, that's right, by a lot – as this final chart shows.
(Click any chart to enlarge.) Closed sales totals were up by 2/3rds for June 2011 compared to June 2010. Statistical quirk or warming trend?
Please see our blog disclaimer.
Listings presented above are supplied via the MLS and are brokered by a variety of agents and firms, not Dave Fratello or Edge Real Estate Agency, unless so stated with the listing. Images and links to properties above lead to a full MLS display of information, including home details, lot size, all photos, and listing broker and agent information and contact information.
Based on information from California Regional Multiple Listing Service, Inc. as of April 29th, 2024 at 6:55am PDT. This information is for your personal, non-commercial use and may not be used for any purpose other than to identify prospective properties you may be interested in purchasing. Display of MLS data is usually deemed reliable but is NOT guaranteed accurate by the MLS. Buyers are responsible for verifying the accuracy of all information and should investigate the data themselves or retain appropriate professionals. Information from sources other than the Listing Agent may have been included in the MLS data. Unless otherwise specified in writing, Broker/Agent has not and will not verify any information obtained from other sources. The Broker/Agent providing the information contained herein may or may not have been the Listing and/or Selling Agent.