You can say what you want about the signs of a wobble in the Manhattan Beach real estate market.
 The data still tell a positive story. There are more sales and a higher median price for MB.
We took a look into the numbers for the first half of 2017.
There were more closed sales (429) for the full 1-year…
You can say what you want about the signs of a wobble in the Manhattan Beach real estate market.
 The data still tell a positive story. There are more sales and a higher median price for MB.
We took a look into the numbers for the first half of 2017.
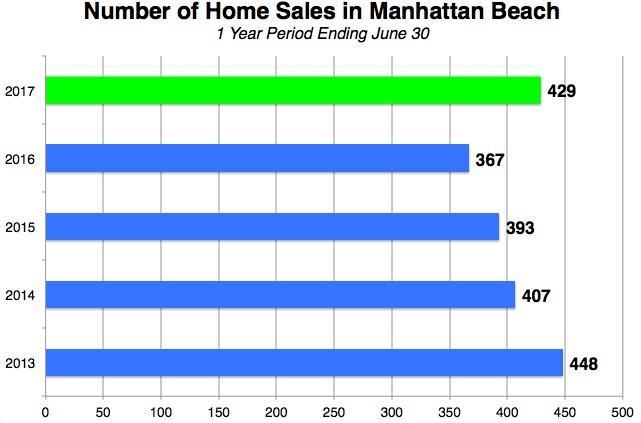
There were more closed sales (429) for the full 1-year period ending June 30 than in any comparable period over the last 3 years. The total marks a notable reversal in what appeared to be a modest downward trend in sales.
Only in the span from July 1, 2012 to June 30, 2013 did you see a higher number of sales. By everyone's understanding, that was the rocket-launch of the recent bull market.
The year-over-year rise in sales was 17%, with the '16-'17 span of July 1-June 30 eclipsing the '15-'16 period by 62 sales.
Higher inventory over this period is, in fact, also helping us to have more sales. There's more to buy.
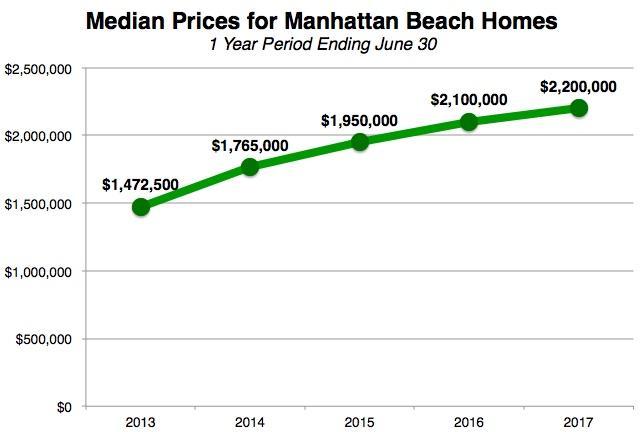
 Meantime, the median price for all Manhattan Beach residential properties was up a modest 5% to $2.200M. That's a simple rise of exactly $100,000 from the '15-'16 period to '16-'17.
It's the culmination of a 49% rise in the MB median price from the '12-'13 period. You almost can't believe that the median was $1.472M only 5 years ago.
What does the median price convey?
Remember, this is the middle number out of a complete set of all the sold prices in the 1-year period under study. Half the homes in this most recent period sold for more than $2,200,000, and half sold for less.
Does this mean that individual homes have become more valuable by 5% since last year? Not necessarily. And there's not much reason to think that would be true, based on individual sales that we've watched.
But more homes at the pricier end are certainly selling, which moves up that middle.
It's the same quirky calculation for every year, with the same caveats and imprecision from year to year.
The bottom line is: We're up again, propelled by a first-half sales pace, with 223 sales, that's 21% over 2016's first 6 months, and 27% over 2015.
Please see our blog disclaimer.
Listings presented above are supplied via the MLS and are brokered by a variety of agents and firms, not Dave Fratello or Edge Real Estate Agency, unless so stated with the listing. Images and links to properties above lead to a full MLS display of information, including home details, lot size, all photos, and listing broker and agent information and contact information.
Based on information from California Regional Multiple Listing Service, Inc. as of April 29th, 2024 at 9:56pm PDT. This information is for your personal, non-commercial use and may not be used for any purpose other than to identify prospective properties you may be interested in purchasing. Display of MLS data is usually deemed reliable but is NOT guaranteed accurate by the MLS. Buyers are responsible for verifying the accuracy of all information and should investigate the data themselves or retain appropriate professionals. Information from sources other than the Listing Agent may have been included in the MLS data. Unless otherwise specified in writing, Broker/Agent has not and will not verify any information obtained from other sources. The Broker/Agent providing the information contained herein may or may not have been the Listing and/or Selling Agent.

 The data still tell a positive story. There are more sales and a higher median price for MB.
 Meantime, the median price for all Manhattan Beach residential properties was up a modest 5% to $2.200M. That's a simple rise of exactly $100,000 from the '15-'16 period to '16-'17.