We've repeated a few times here the "buzz" that's out there in the field now, to the effect that the South Bay real estate market, and even the Manhattan Beach market, both are slowing or changing.
And we've tried, without much success, to find any statistics that would show this to be the case. (See this post, this one and this also.)
Any statistical declines, where we've found them, mostly were by comparison to a "sugar-high" boom last year. So far, 2018 remains among the best of the past 5 years for local real estate.
But everyone can't be crazy.
 If people are seeing, or feeling, a change in the market, it might really be happening.
And if you're hearing it from realtors, a cheerleader-type class of people if there is one, then it's worth paying attention. Real estate salespersons are not known for talking down their book.
Maybe the realtors are the proverbial canaries in the coal mine.
Specifically, we will now look at stats from the California Association of Realtors (CAR).
They use real economists, not cute little yellow birds, to collect and analyze statistics from all across California.
The most recent data release from CAR uses a few worrying turns in housing stats to suggest, forbodingly, that this is the beginning of a wholesale change in market conditions... even if none of the stats truly appears all that concerning yet.
 For instance, a CAR press release from last week sets a tone with this lead-in:
"The California housing market posted its largest year-over-year sales decline since March 2014 and remained below the 400,000-level sales benchmark for the second consecutive month in September, indicating that the market is slowing as many potential buyers put their homeownership plans on hold..."
Oh no! Worst sales decline since March 2014!
We all know what happened after that!
Oh, right, a continued statewide boom for the next 4 years.
Here are some things CAR is worried about:
• Higher inventory: Highest level in 31 months
• Time on market up: Median DOM is increasing
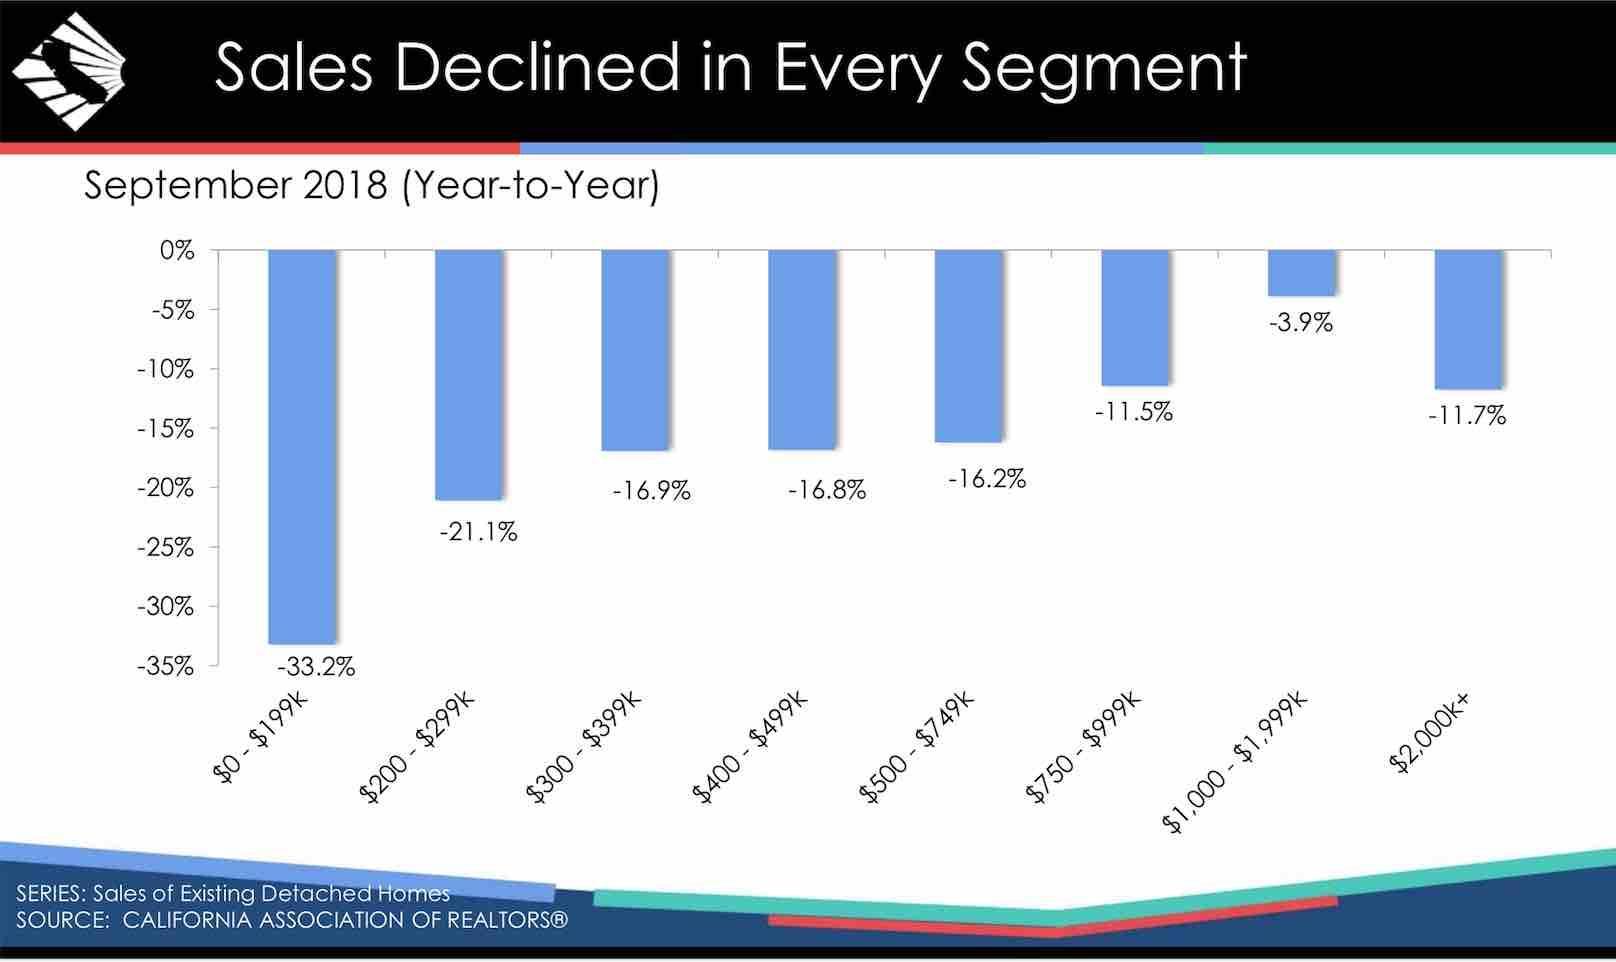
• Fewer sales: Year-over-year drops in # of sales in all price tiers (Sept. 2017 vs. Sept. 2018)
• Price deceleration: "Price growth" isn't growing as much; median price up, but by smallest amount since Dec. 2012
• Sale prices below asking prices: A sale price to list price ratio is at the lowest level in 20 months
If we stopped right there, you might say, Whoa, Nellie, batten down the hatches, there's a storm a-comin'.
 And Nellie might sensibly ask, May I see those charts, first?
Yes, let's look at the charts.
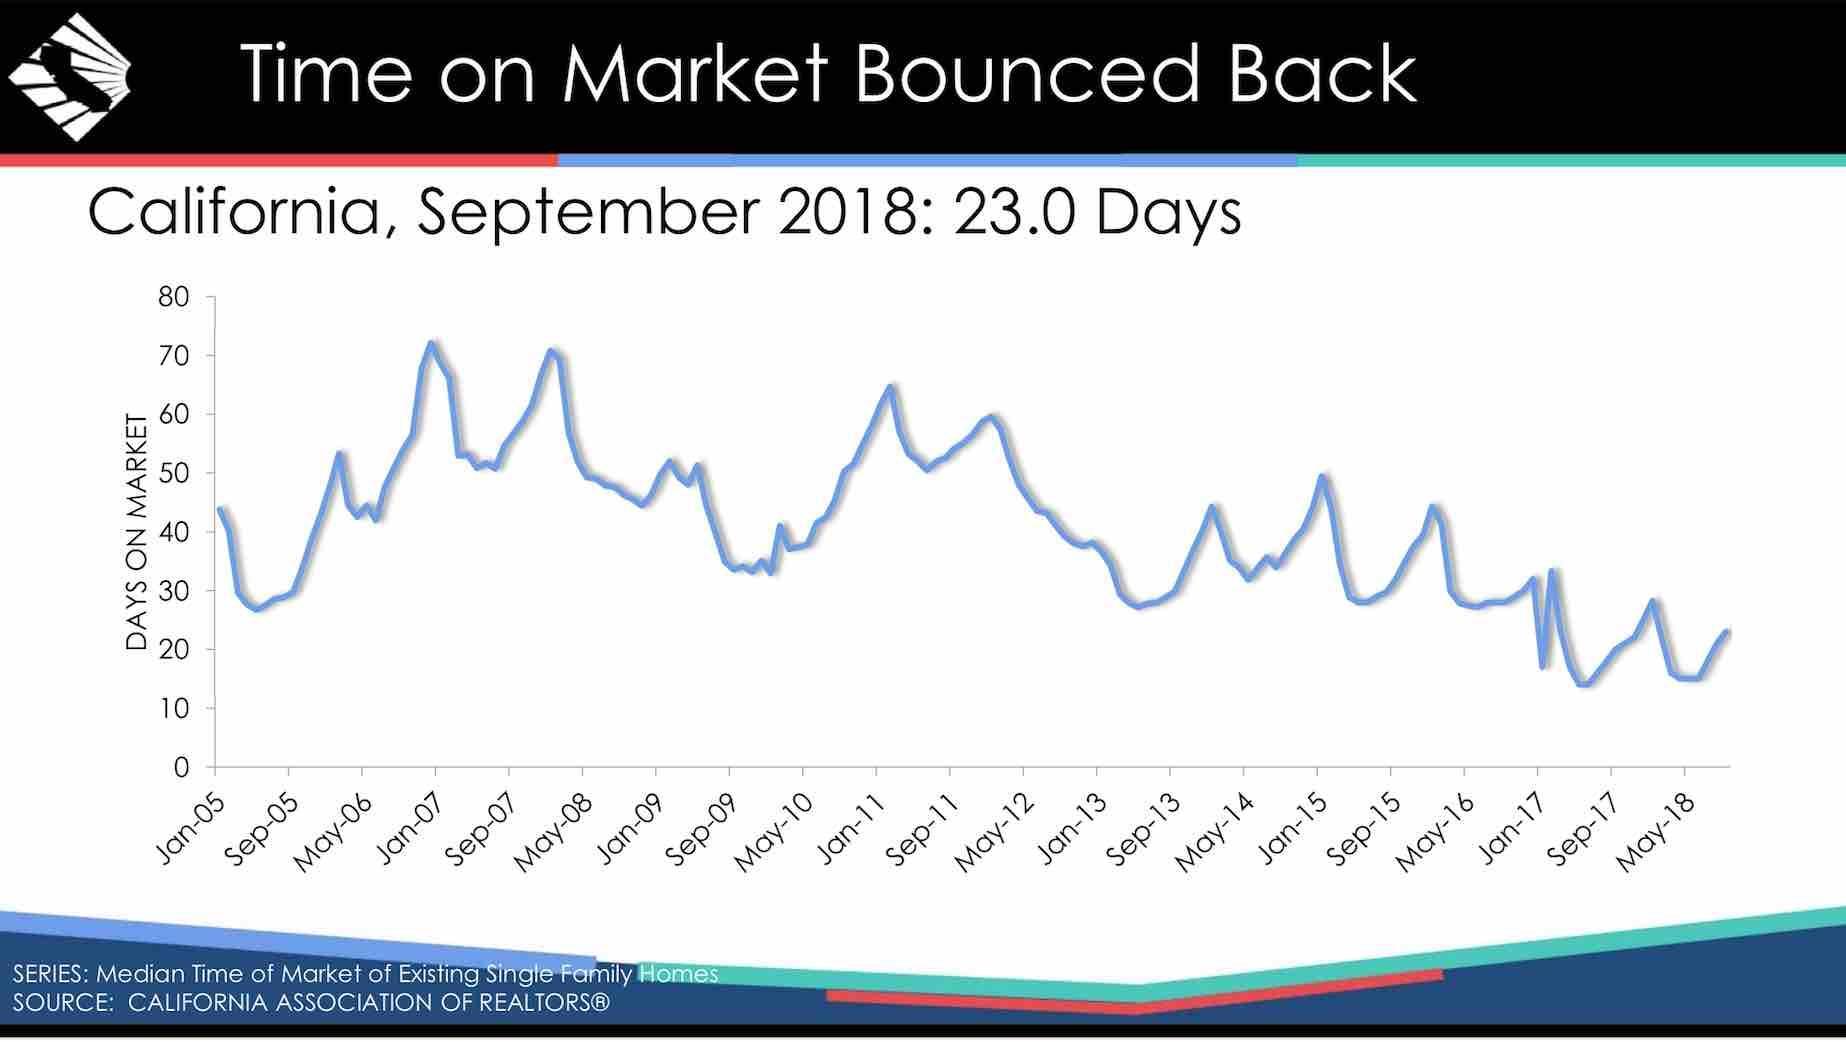
Looking at how "Time on Market Bounced Back," you can see that the median DOM figure statewide for Sept. 2018 was 23.0 days.
Is that high?
Not really. It's lower than any time on the chart prior to January 2017. And the chart goes back to 2005! (Note: It shows only resales of SFRs.)
But, yes, it does look like that year-over-year pace of sales dropped in every category (see that chart higher up with the negative blue bars - blue for negative, hmmph).
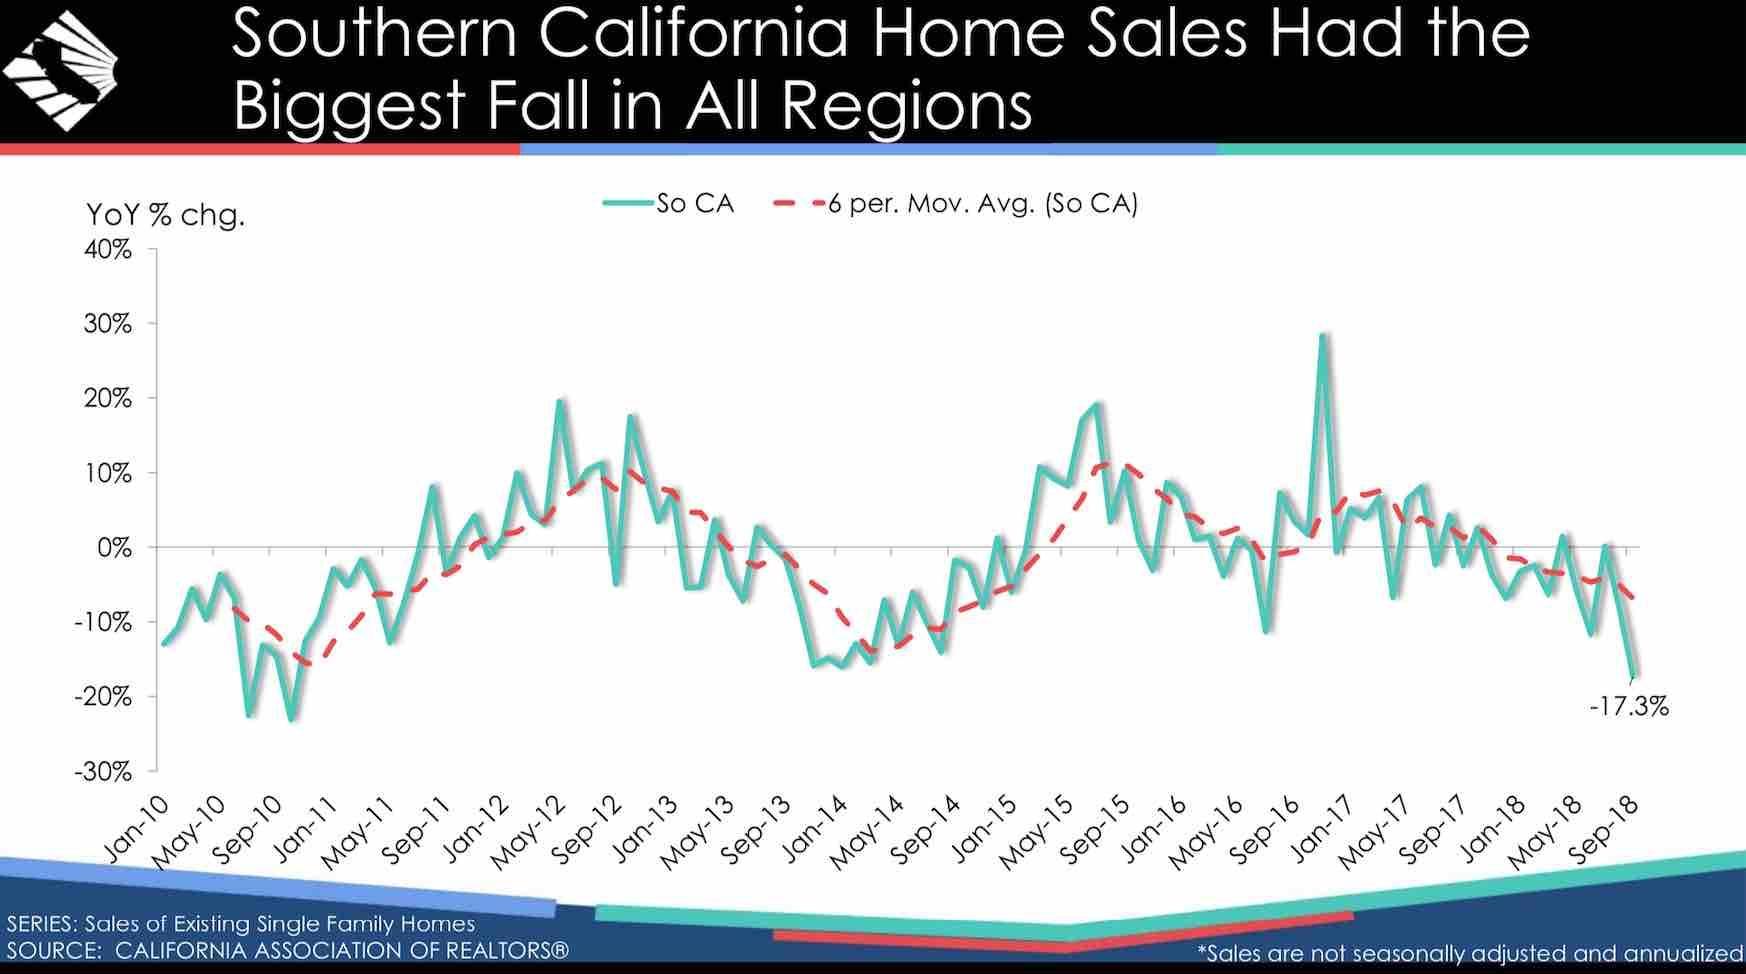 And the decline in the sales pace (for SFRs) is worse for Southern California, according to another chart.
The downward-pointing red dotted line is the one you would focus on. Where it crosses below zero, the data show a trend toward the pace of sales declining.
Then again, you can see that the pace of sales in So Cal has now dropped 3 times since 2010, even amid a booming housing market. In other words, the trend can be up or down, and may not bear a great relationship to the health of the market.
The green line is very bumpy, but does show sales in September being lower than in August this year.
How about the list-price-to-sale-price ratio? How bad is it?
The typical resale SFR is now selling for 98.5% of the last list price.
The ratio has been lower 4 times since 2013. Worried yet?
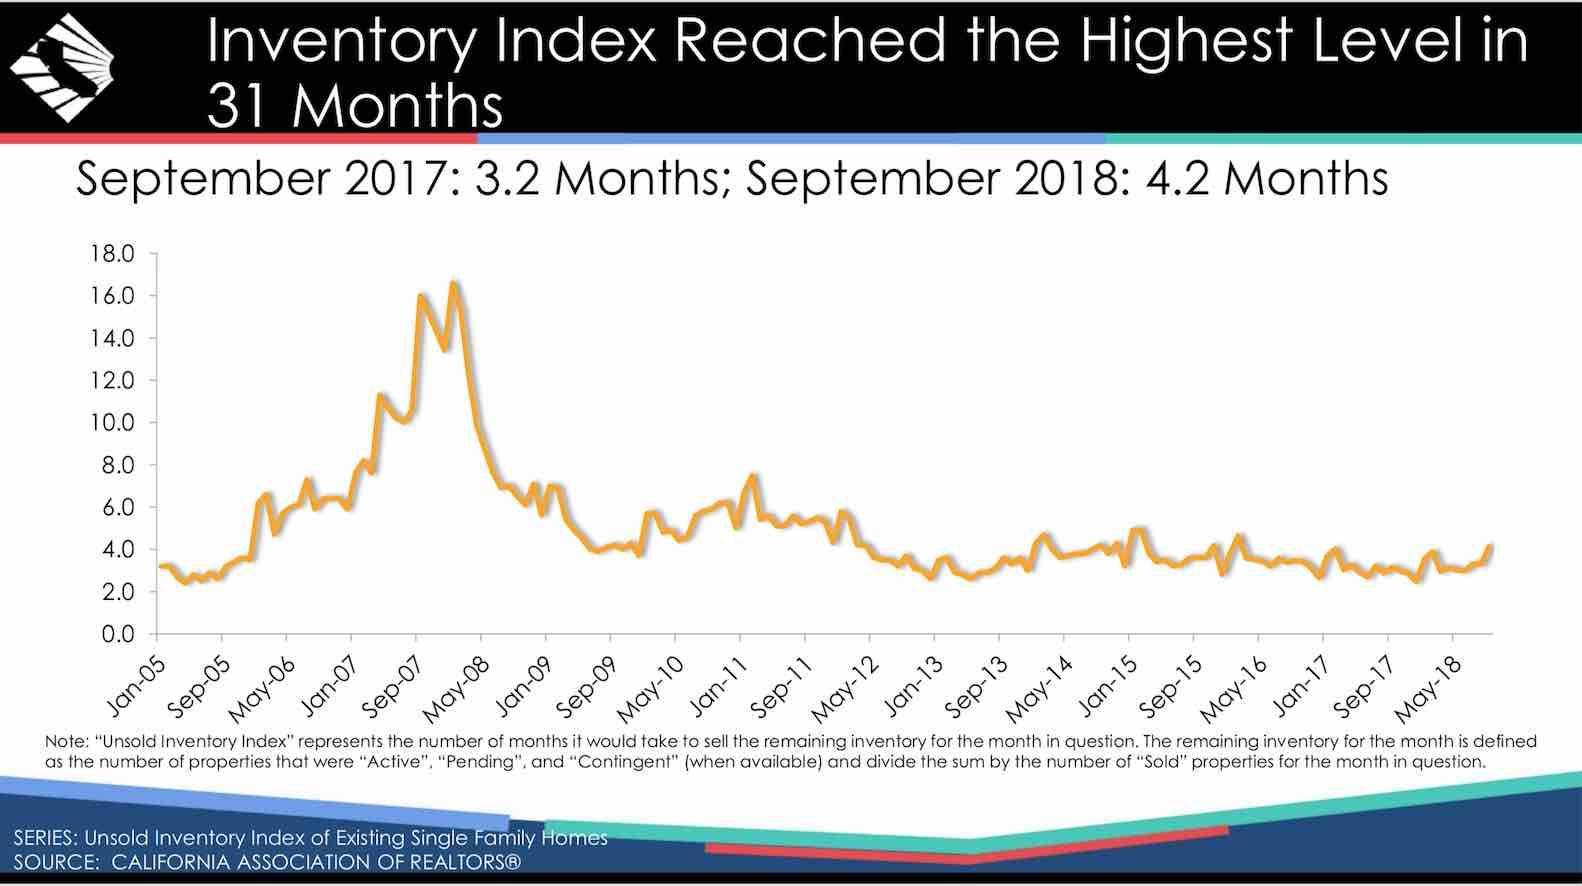 Remember that bullet point about inventory being highest in 31 months? Here's that chart.
This is actually an "index" reflecting the "months of inventory" (again, for resales of SFRs).
Given the number of homes for sale, and the pace at which they're going into escrow and selling, Sept. 2018 is up a whole month over Sept. 2017 to 4.2 months. It was last at that level in early 2016.
Otherwise, the line looks pretty flat from early 2012-present, with the scary times occurring way, way back, from mid-2006-early 2008.
An old rule of thumb was that an inventory index like this needed to hit 6 months to declare a "buyer's market." Some modernist/contrarians these days argue that the internet makes the sales process so much faster and more efficient, that now an index of 4 months or more represents a buyer's market. Discuss.
But the index data don't look all that scary, yet.
Here's what we don't see in most of the CAR charts: Clear indications that Manhattan Beach is currently defying gravity, while everyone else is having a hard time. Really, our local data look a lot like the statewide data at this point.
That's significant, because a market like Manhattan Beach real estate often declines last, after other markets and after the trend has taken hold for a while.
If something is afoot statewide in California real estate, it looks like it's just beginning.
Maybe the canary is coughing a little bit, as these charts (and more in the full CAR data set) do seem to suggest something that the economists feel is inevitable. The market's been a bull for 7+ years, and has to turn around.
The national Case-Shiller index is starting to show a slowdown, too, but also more in the form of "prices aren't continuing to rise quite as fast as before," which isn't obviously alarming.
If the stock market's down, mortgage rates are up notably and the impact of the tax "reform" law is about to hit, you can see why sentient persons might be ready to declare the housing market's shift to a buyer's market.
You know who really gets to declare a buyer's market? Buyers.
Buyer sentiment and behavior early next year will tell us more than the stats, or canaries, do right now.


