MBC noted the other day that the median price for SFRs in MB is at 2004 levels so far in 2009:
- 2004 (full year): $1.450m
- 2009 (thru Sept. 30): $1.467m
We also questioned what good a median figure is unless the home you're interested in is, in fact, a "median house," whatever that means.
Medians are trend data.
…
MBC
noted the other day that the median price for SFRs in MB is at 2004 levels so far in 2009:
- 2004 (full year): $1.450m
- 2009 (thru Sept. 30): $1.467m
We also questioned what good a median figure is unless the home you're interested in is, in fact, a "median house," whatever that means.
Medians are trend data.
Same-house sales provide a more tangible window into what's going on in the local RE market.
So we've compiled a list of homes acquired from 2003-2006 that have been resold in recent months.
(Links to the spreadsheets are below.)We'll start with an initial conclusion:
MBC needs to stop saying we are "living in 2005 prices" in MB today. The data show 2005 acquisitions generally losing money upon resale. Same-house sales tell us MB (west of Sepulveda) must be living
in 2004 right now – just as the median price data say, too.
Our nerdy notes: The data in this story cover only closed sales, only SFRs, and only SFRs west of Sepulveda. Our initial ambition was to list every home that was for sale with a recent acquisition date, to look at canceled listings and even homes in escrow. The added complexity didn't really add insight, so we tossed that data for now.
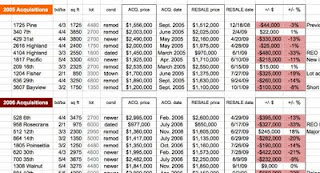
MBC has created online spreadsheets to display this data, including basic home details, acquisition price/date, resale price/date, and the price increase/decrease from acquisition to resale. Each acquisition year (2003-2006) is treated separately. There are 2 sorts of the same data:
1) A sort by acquisition date (click to view in a new tab/window)
2) A sort by resale date in 2009 (click to view in a new tab/window)
You can also use a tab at the top of either spreadsheet to view the other.
Let's look at these resales by individual years, but
not in chronological order, to keep the story interesting.
2003 Acquisitions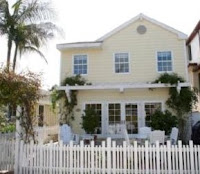
First, the good news. The 4 homes we found that were first purchased in 2003 and resold in 2009 all made money upon resale.
Markups ranged from 12% up to 39% at
408 9th (pictured), a perfect walkstreet remodel that sold for
$2.160m in April. A close second was
929 John, up 26% when it sold for $1.499m, and quickly, in June.
There's a short sale on the list, but it didn't drop below 2003 prices. That was
465 30th, a big, newer home MBC called "voluptuous" at one point (for more see "
The Trouble with Shorties"). It closed 13% above its Oct. 2003 acquisition price.
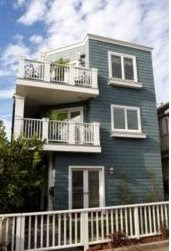
2006 AcquisitionsThis has not been a good year to unload a property bought in 2006.
Of the 9 homes we found, 7 lost money – quite a bit in each case. Prices were down on those 7 by $190,000 to $650,000, a percentage range of
9-33% off from 2006. Dropping an outlier REO on Rosecrans, the top drop was
23%.
The homes in this list cover a good range and include some very desirable properties, including:

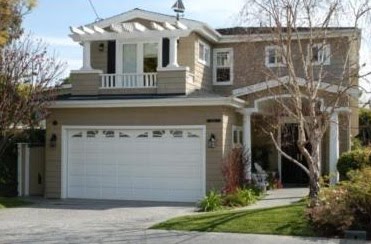
One exception to this trend was
1308 Walnut (pictured), which had some upgrades – including the kitchen – since acquisition. It sold for $9k more than its purchase price, still a net loss for the owners, but holding value overall. Not easy in that location.
The other exception really needs an asterisk –
512 12th was taken down to studs and redone completely over the past few years. It was marked up over 2006, but whether the sellers recouped their costs is questionable.
2005 AcquisitionsOne look at these data convinced us to stop repeating that MB is now in 2005 prices. Only 2 of 10 homes bought in 2005 and resold in 2009 got out flat – both for 1% more than their purchase prices. Both were on great streets – 16th west of Highland and the flat 7th St. walkstreet.
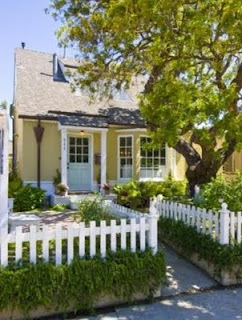
(Location, something, something.)The rest took losses in the hundreds of thousands of dollars, 5 of them more than $200k, 3 over $300k. Percentage drops were mainly in the teens, just a bit lighter than the 2006 resales' losses. A selection:
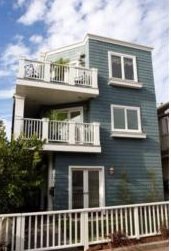
 429 31st, a dandy Cape Cod on the plateau in the Sand (pictured), dropped $330k (-13%) over almost 4 years.
- 1817 Pacific was new in 2005, and still beautiful this year when it sold for less (-215k/-11%).
- 1204 Fisher was a different bird, a lot sale in 2005 meant to make way for the third home in the Fisher King & Queen set. When those spectacular moderns proved to be not so profitable, the lot was dumped (-$325k/-19%).
We have to treat
4104 Highland (-$480k/-33%) as an outlier. It's an REO whose 2005 purchase price is suspect, as it seems to have been literally bought with other people's money.
Looking at the 2005 data set as a whole, it seems silly to have allowed that fiction about 2005 prices to have gone on so long. Purchases from that year have lost money this year, clearly pushing values into 2004 somewhere. So how have 2004 acquisitions fared?
2004 AcquisitionsReady for a surprise?
Almost all 2004 acquisitions resold in 2009 have been successfully marked up. The exceptions are a gutted home (
1733 Elm) and a compromised location (
3505 Pacific).
We found 9 homes west of Sepulveda that were resold this year. Some had small markups, while a few were in the teens and 20s, percentage-wise, over 2004.
Let's look at a few of the resales:
 444 8th (pictured) is another South End walkstreet cutie. (Also yellow, like 408 9th, hmmm.) Wow, $1.8m for 1500 sq. ft. Scarcity and location helped with a 28% markup.
- 1042 2nd offers lots of space and something less – a location issue near Sepulveda and next to a commercial tower. Good for a 24% markup. (See "Atypical Deal on the Hill.")
- 225 9th, a typical 60s box with a few updates, right downtown, got out flat (+$40k/+3%) at $1.240m.
So, to review – we're not in 2005 today.
But 2004 sales are getting their markups.
Did we miss a year in there somewhere?
Please see our blog disclaimer.
Listings presented above are supplied via the MLS and are brokered by a variety of agents and firms, not Dave Fratello or Edge Real Estate Agency, unless so stated with the listing. Images and links to properties above lead to a full MLS display of information, including home details, lot size, all photos, and listing broker and agent information and contact information.