Inventory of homes for sale has most likely peaked for the year, so it's time to begin to look back at the year that was.
First, MBC's count of active SFRs west of Sepulveda for the end of November was 119, the highest month-end total we've recorded in about 21 months of operations. (All data are from the end of a…
Inventory of homes for sale has most likely peaked for the year, so it's time to begin to look back at the year that was.
First, MBC's count of active SFRs west of Sepulveda for the end of November was
119, the highest month-end total we've recorded in about 21 months of operations.
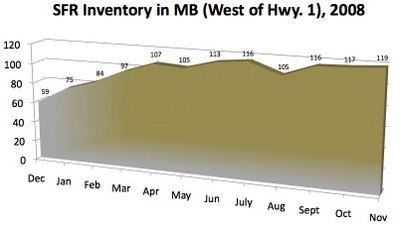
(All data are from the end of a given month; click graph to enlarge.) Day to day, we've seen inventory go a bit higher, and, in mid-October, it was at
124 – the peak for 2008 among our twice-monthly MB Market Updates.
We won't see those records broken in December. All over town, the listing-cancellation frenzy we've noted for a few months as sellers have been quitting the market is now giving way to a less frenzied, more traditional rush of cancellations – the Holiday Season Dropoff.
In November, for instance,
20 listings dropped out. Many, no doubt, will return in 2009. The bigger surprise for the month was that new listings
(starting in November!?!) exceeded cancellations by 3.
Our first graph above shows that
inventory doubled over the course of the year – counting from the end of December 2007 to the end of November 2008 – from 59 to 119. That's some kind of a sign of the times, but these figures are especially interesting when contrasted with 2007 data.
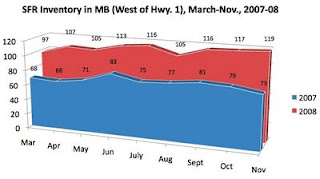
The second graph here
(click the graph to enlarge) compares SFR inventory west of Sepulveda for like periods of 2007 and 2008. MBC's first month-end Market Update Spreadsheets were published in March 2007, so the comparison here spans 9 months, not 11.
Obviously, in each month, 2008 inventory was consistently higher than inventory in the previous year.
One fact we found striking in the graphic: the levels hit in the Spring seemed to remain fairly stable throughout each year. Supply and demand have their own little dance going on, keeping active inventory within about a 20% range from peak to valley, mostly narrower.
The greatest gap between 2007 and 2008 inventory levels happens to be current – right here, right now.
After Thanksgiving last year, buyers looking at SFRs west of Sepulveda had
73 options to choose from. This year they had
119 options, fully
46 additional homes. That is a remarkable 63% increase in inventory now over last year.
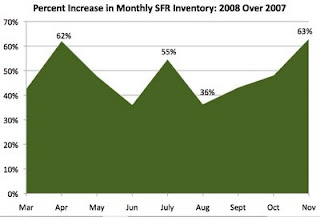
We decided to go back and examine the percentage difference in SFR inventory, month-by-month, from 2007 to 2008. In this final graph
(click graph to enlarge), we see the disparity peaking twice, in Spring and Fall – both times more than 60% higher than last year. Inventory in 2008 was rarely less than 40% higher than 2007.
From separate data, we have clear evidence of declining home sale prices locally, though they're not steep, as of yet. (See "
How're Median Prices Doing?")
Yet, as this inventory data suggests, a nasty brew is coming together. Inventory is up dramatically over 2007 levels, and, it bears repeating, 2007 was the slowest year for local RE sales in at least 20 years (see "
Maybe It Can't Get Worse"). Meanwhile, 2008 is on pace to be substantially worse (see "
Turns Out '08 Got Worse").
Higher inventory, fewer buyers, fewer sales and a broad-scale economic meltdown. These are all very bearish portents where prices are concerned, even as it is equally clear that MB has held up better, overall, than many neighboring communities.
Please see our blog disclaimer.
Listings presented above are supplied via the MLS and are brokered by a variety of agents and firms, not Dave Fratello or Edge Real Estate Agency, unless so stated with the listing. Images and links to properties above lead to a full MLS display of information, including home details, lot size, all photos, and listing broker and agent information and contact information.


