With Q3 2023 wrapped up just about 10 days ago, we're continuing to study the market based on data that comes out of that first, main chunk of the year.
We've already taken a first look at inventory trends and sales totals in our recent market update.
Here's a closer look at some more noteworthy data points.
Median Price Kept Wobbling
The median home price for Manhattan Beach has remained pretty solid, even rising after Spring 2022 interest rate jumps froze the market last year, ending the 2020-21 rally.
After holding up at a high level, the median price seemed to reset abruptly this Summer.
The figure may wobble a bit now, but seems to be sticking in this new territory.
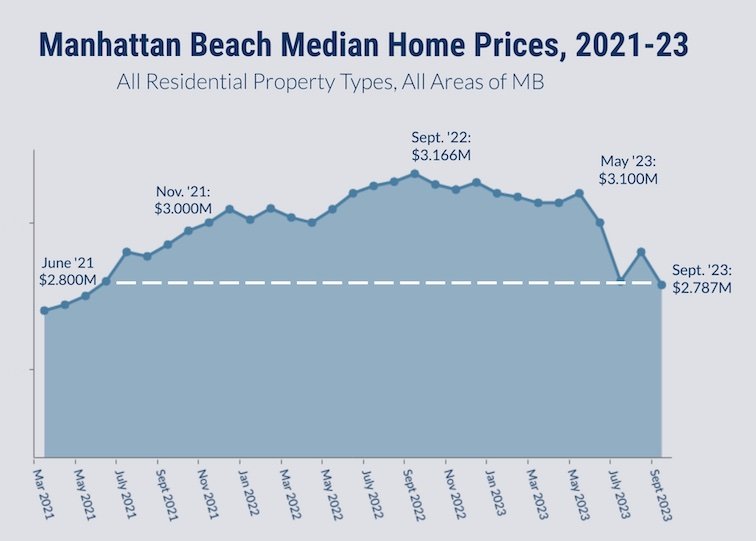
The shocking drop from $3.100M to $2.800M occurred between May and July, then the median bounced a little up to $2.900M in August. Now it's lower at $2.787M.
That's a bit lower than June 2021's $2.800M.
Looking at pending escrows in Manhattan Beach today, there are fewer than 20, but the median price among those is $4.000M.
Dollar Volume Stopped Dropping, Now Rising
With less inventory and many, many fewer sales, naturally the amount of money being spent by buyers for local homes has been dropping for a long time.
That trend has finally ended, and there's a modest uptick now.
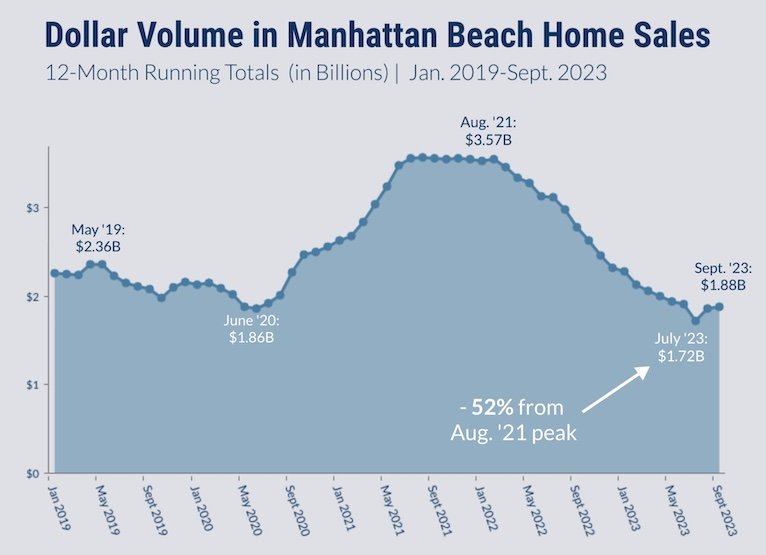
We pull data for home sales dollar volume in 12-month blocks.
As the late-2020 and early-2021 markets became frenzied, that dollar volume eclipsed $3 billion for the first time in history. August 2021 became the peak at $3.57B.
But soon after, and throughout 2022 and most of 2023, it was a steep ski slope downward.
The 12-month dollar volume figure dipped under $2 billion in May this year, and bottomed out in July at $1.72B.
That "valley" was less than half the peak value from almost 2 years prior, down 52% from Aug. 2021. (Gulp!)
Now, dollar volume is up again.
August was the first bounceback month, and September closed at $1.88B.
A small caveat: Dollar volume does tend to decline late in the year and into January/February of the ensuing year. So we won't be surprised if this figure wobbles a bit.
Months of Supply Keeps Rising
A common measure of market activity aims to capture the pace of sales relative to inventory.
That figure is called "months of supply," and it's been rising without interruption for 18 months.
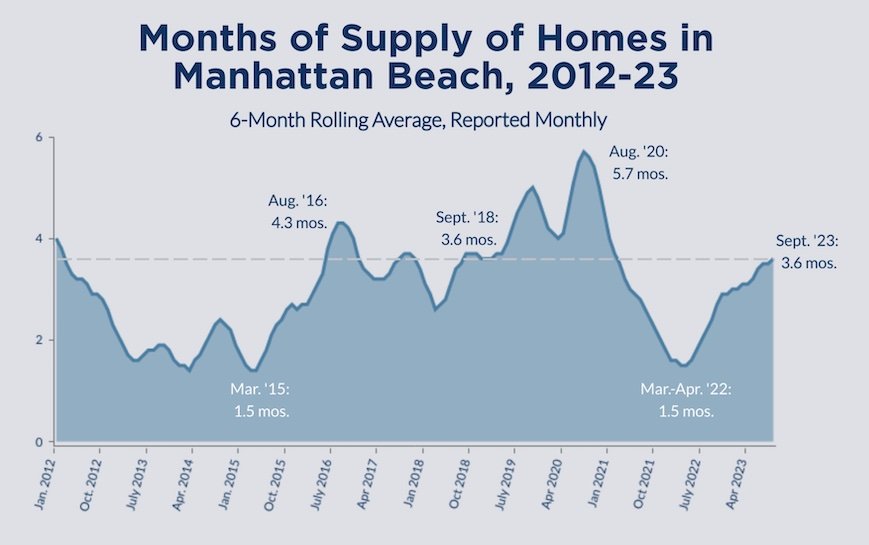
"Months of supply" takes into account the pace and number of homes going into escrow, along with active inventory. The number of months is a figure that estimates how long it would take to sell every listing on the market.
It's not too alarming that months of supply rose from early 2022, when it was at an incredible low of 1.5 months. Imagine going to Target day after day, finding there's a line at the door, and by the time you get inside, there's almost nothing but empty shelves. That's what 1.5 months looks like in housing.
Now that months of supply has reached 3.6 months, we're at a point that has somewhat rarely been seen in our market, just about 3 years total out of the past full 12 years. Most of that time at 3.6 months or higher was in the cooling market of 2018-19 and the first year or so of the covid-19 pandemic.
The conventional wisdom with "months of supply" used to be that 6 months signaled a "buyer's market." But in the internet age, it's more accepted that about 4 months equals a buyer's market.
Mainly this is a trend to watch.
Buyers don't necessarily feel like it's a buyer's market. There's little inventory, and not too much give in prices.
We've been surprised to see "months of supply" rising at a time when inventory is low, days on market to sell is low (11 DOM) and nothing really seems to be hanging around.
But that's why we track data, and don't only go on anecdote.
Please see our blog disclaimer.
Listings presented above are supplied via the MLS and are brokered by a variety of agents and firms, not Dave Fratello or Edge Real Estate Agency, unless so stated with the listing. Images and links to properties above lead to a full MLS display of information, including home details, lot size, all photos, and listing broker and agent information and contact information.

