Remember not so very long ago when the Manhattan Beach market saw its busiest 2-week period in a while?
That was the second half of October, a brief period rollicking with 21 new escrows, so notable that we renamed the month "Hot-Tober."
And then November... really wasn't like that.

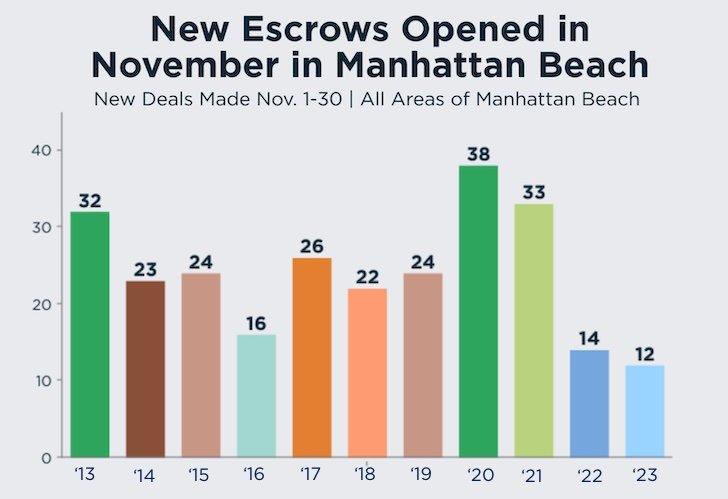
Nope, there was no momentum, really, from October into November, with the whole month ending with just 12 new deals.
As our chart above shows, 12 new escrows for the whole month sets a new low for recent years, lower than any of the prior 10 years, lower than last year's sluggish pace, lower than the dreaded Fall of 2016.
With 5 of the prior 10 Novembers all coming in at the mid-20s, you could say this past month was seeing new deals at about half of the normal pace.
And now, looking back, that little 2-week period of October with 21 new deals was literally the very hottest 2-week period in the entire year of 2023. So, it was worth reporting on, for sure, but it turns out that period was the anomaly in an otherwise slower year.
There's going to be less and less inventory to chew on now as the holidays kick in.
All over the market, we've seen listings cancel or expire at a higher pace than they are going under contract. That's to be expected, as sellers decide they'd rather not show their homes while decorating for the holidays, or hosting family and friends.
We'll say this: Sure, 2023 has been slow, with too few sellers and too many challenges for buyers.
But almost every time in the past 15 years that it looked like that kind of grim Fall mood would bleed into the next year, the next year surprised to the upside, with more sales and a rally in prices.
No one is predicting a big rally for real estate in 2024 – literally no one – but let's just see how it goes here in Manhattan Beach. Sometimes we're trend-setters.
One thing we're going to have to talk about here soon is prices.
Something's going on with prices. We're working on some data. Check this space next week.
------------------------------------------------------
Here's the rest of our local real estate market update report for the period ending 11/30/23:
> 70 active listings as of 11/30/23 (-7 from 11/15/23)
> 52 SFRs (-7)
> 18 THs (Flat)
See the Inventory list as of 11/30/23 here, or see the MB Dashboard for up-to-the-minute data.
Active listings by region of Manhattan Beach in this report:
> Tree Section: 18 actives (-2)
> Sand Section: 33 actives (Flat)
> Hill Section: 7 actives (-2)
> East MB: 12 actives (-3)
We're also providing a report on closed sales by region of MB.
Sales data, including PPSF for all properties, are organized by sub-region of Manhattan Beach.
Here's a link to the spreadsheet: "MB Pending/Sold as of 11/30/23".
Please see our blog disclaimer.
Listings presented above are supplied via the MLS and are brokered by a variety of agents and firms, not Dave Fratello or Edge Real Estate Agency, unless so stated with the listing. Images and links to properties above lead to a full MLS display of information, including home details, lot size, all photos, and listing broker and agent information and contact information.


