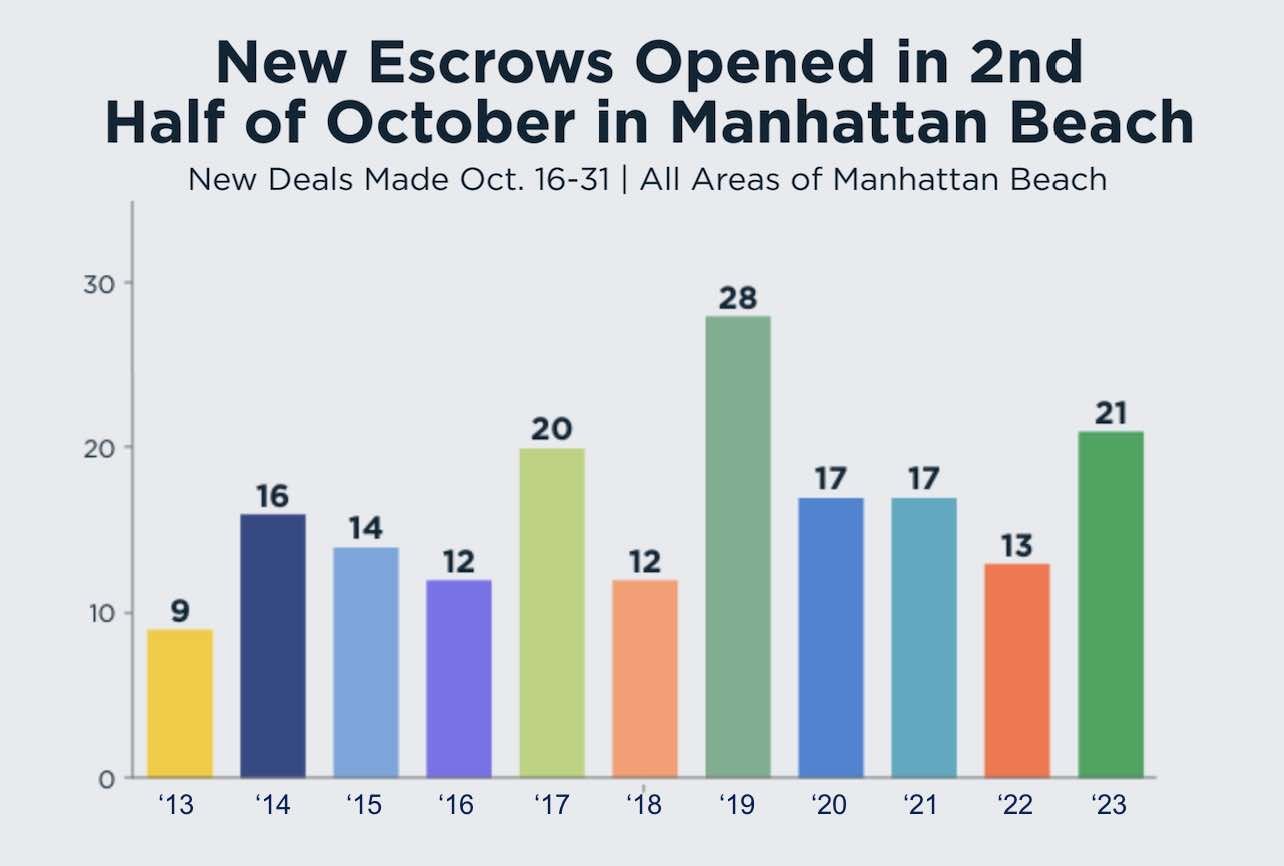
The second half of October 2023 in Manhattan Beach was the busiest with new escrows of the past 4 years.
In fact, with 21 new escrows opened, the second half was busier than all but one of the prior 10 years during the same period.

Raise your hand if you saw this coming.
[Shields eyes; squints; looks out across crowd]
Wait, no one saw this coming?
In a year that's had low inventory and fewer sales than any over 2 decades, this is one of the extremely rare high points where 2023 has seen greater performance than other years.
October became Hot-Tober, it seems.
To be clear, the overall performance of October 2023 was lukewarm, in the middle-to-lower tier comparing all the prior 10 Octobers. So the big bump was really just in the second half of the month.
Isn't that some kind of amazing?
The headlines are rife with talk of high mortgage interest rates, and potential challenges to the real estate market.
One lesson: Don't bet against the Manhattan Beach real estate market.
Almost all of the new deals this period were in the Tree Section (9) and East Manhattan (10). If you blinked, you missed it.
Here are all of the new deals in those two areas during this period. (Click any address to see the full listing.)
Tree Section
| ADDRESS | BD/BA | SQFT | LOT | PRICE | $PSF | DOM | START $ | START |
|---|
| 601 13th Street |
4/2 |
2,037 |
2,106 |
$2,700,000 |
$1,325 |
5 |
$2,700,000 |
10/26/23 |
| 826 18th Street |
6/5 |
5,530 |
10,398 |
$6,800,000 |
$1,230 |
57 |
$7,250,000 |
09/05/23 |
| 3629 Oak Avenue |
3/3 |
1,822 |
4,294 |
$1,999,000 |
$1,097 |
13 |
$1,999,000 |
10/19/23 |
| 1813 Walnut Avenue |
5/6 |
3,150 |
4,480 |
$4,400,000 |
$1,397 |
61 |
$4,499,000 |
09/01/23 |
| 590 30th St |
5/7 |
5,839 |
4,805 |
$6,599,000 |
$1,130 |
89 |
$6,999,000 |
08/02/23 |
| 665 13th Street |
3/2 |
2,448 |
2,709 |
$2,899,000 |
$1,184 |
55 |
$2,999,000 |
08/30/23 |
| 1215 Fisher Ave |
5/6 |
5,400 |
3,000 |
$7,999,000 |
$1,481 |
27 |
$7,999,000 |
10/05/23 |
| 1720 Walnut Avenue |
5/5 |
3,558 |
4,485 |
$5,100,000 |
$1,433 |
34 |
$5,100,000 |
09/28/23 |
| 1701 N Poinsettia Avenue |
3/2 |
1,840 |
5,946 |
$3,275,000 |
$1,780 |
9 |
$3,275,000 |
10/06/23 |
East Manhattan Beach
| ADDRESS | BD/BA | SQFT | LOT | PRICE | $PSF | DOM | START $ | START |
|---|
| 1612 Magnolia Avenue |
4/2 |
1,236 |
4,865 |
$1,885,000 |
$1,525 |
6 |
$1,885,000 |
10/26/23 |
| 448 Altura Way |
3/2 |
1,564 |
7,950 |
$1,825,000 |
$1,167 |
46 |
$1,900,000 |
09/14/23 |
| 1612 11th Street |
3/2 |
1,407 |
7,498 |
$2,300,000 |
$1,635 |
99 |
$2,300,000 |
07/25/23 |
| 1204 Faymont Avenue |
4/4 |
3,598 |
5,088 |
$3,650,000 |
$1,014 |
48 |
$3,800,000 |
09/14/23 |
| 1456 Manhattan Beach Boulevard C |
2/3 |
1,152 |
9,849 |
$1,150,000 |
$998 |
19 |
$1,150,000 |
10/12/23 |
| 13 Coronado Court |
3/3 |
2,023 |
2,418 |
$1,950,000 |
$964 |
12 |
$1,950,000 |
10/20/23 |
| 1750 Marine Avenue |
3/2 |
1,292 |
5,073 |
$1,500,000 |
$1,161 |
12 |
$1,500,000 |
10/19/23 |
| 1837 11th Street A |
4/3 |
2,122 |
6,501 |
$1,699,000 |
$801 |
103 |
$1,749,000 |
07/21/23 |
| 1208 23rd Street |
3/3 |
2,157 |
5,007 |
$2,495,000 |
$1,157 |
18 |
$2,495,000 |
10/13/23 |
| 1807 9th Street |
3/2 |
1,487 |
7,498 |
$1,900,000 |
$1,278 |
7 |
$1,900,000 |
10/13/23 |
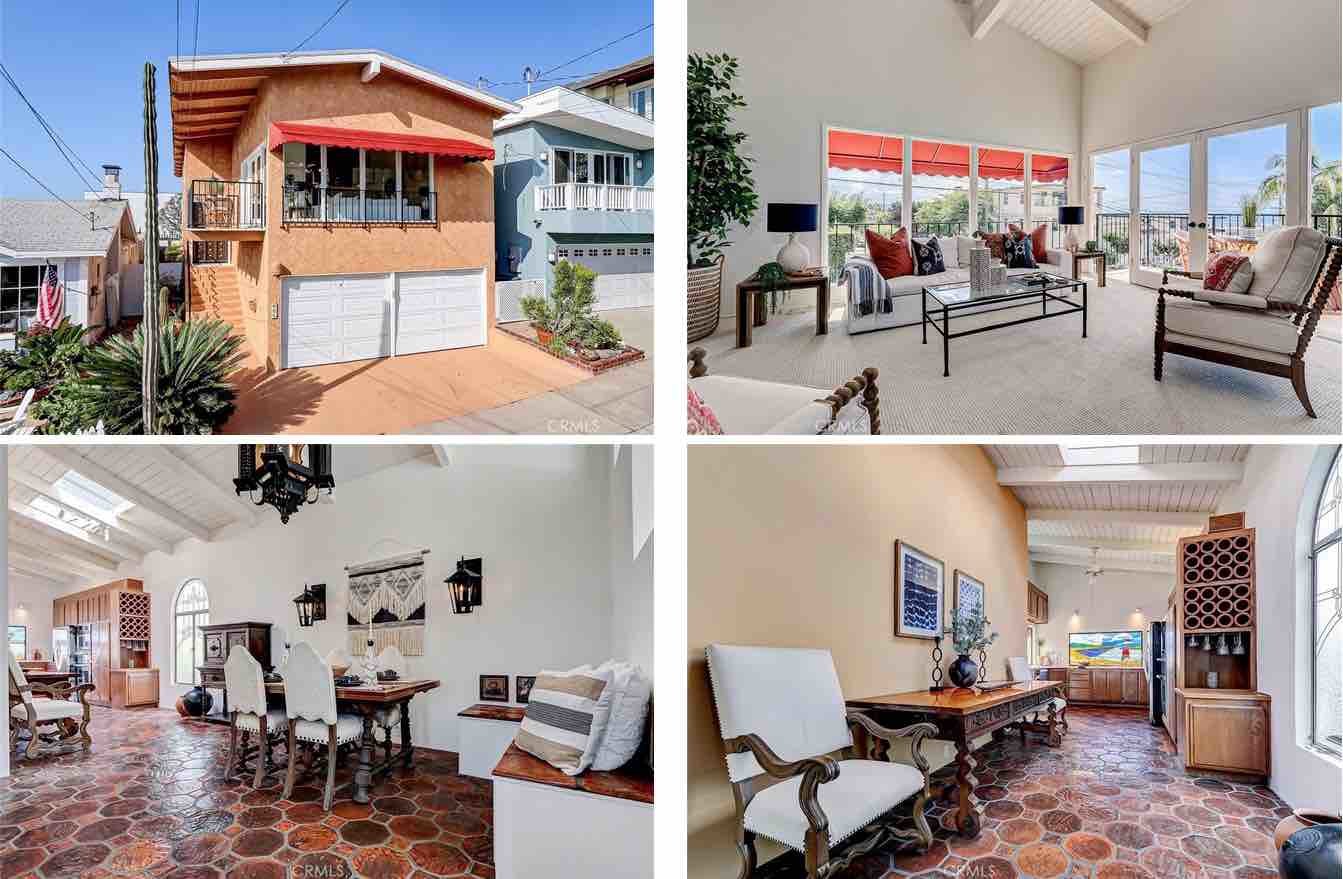
We're glad to have done our part, with our listing at 601 13th St. drawing a quick offer in late October. (Asking $2.700M.) Here are a few images from that one:

Inventory had bounced around near 80 off-and-on in parts of September and October, but we ended October at just 69, due partly to the new deals, and to several listings canceling to wait for next year.
------------------------------------------------------
Here's the rest of our local real estate market update report for the period ending 10/31/23:
> 69 active listings as of 9/30/23 (-5 from 10/15/23)
> 53 SFRs (-5)
> 16 THs (Flat)
See the Inventory list as of 10/31/23 here, or see the MB Dashboard for up-to-the-minute data.
Active listings by region of Manhattan Beach in this report:
> Tree Section: 22 actives (+1)
> Sand Section: 26 actives (+1)
> Hill Section: 11 actives (+1
> East MB: 10 actives (-8)
We're also providing a report on closed sales by region of MB.
Sales data, including PPSF for all properties, are organized by sub-region of Manhattan Beach.
Here's a link to the spreadsheet: "MB Pending/Sold as of 10/31/23". (5br/4ba, 3383 sqft.)
Please see our blog disclaimer.
Listings presented above are supplied via the MLS and are brokered by a variety of agents and firms, not Dave Fratello or Edge Real Estate Agency, unless so stated with the listing. Images and links to properties above lead to a full MLS display of information, including home details, lot size, all photos, and listing broker and agent information and contact information.


