It's early, it's early. The Spring real estate market in Manhattan Beach is only now getting going.
But it's getting going at a time when the recent sales pace has been rolling nicely.
We kinda feel that, but as a nerdy operation here, we figured we should get some data, graphs and charts. (C'mon, you've got…
It's early, it's early. The Spring real estate market in Manhattan Beach is only now getting going.
But it's getting going at a time when the recent sales pace has been rolling nicely.
We kinda feel that, but as a nerdy operation here, we figured we should get some data, graphs and charts. (C'mon, you've got some inner nerd, too. Enjoy it.)
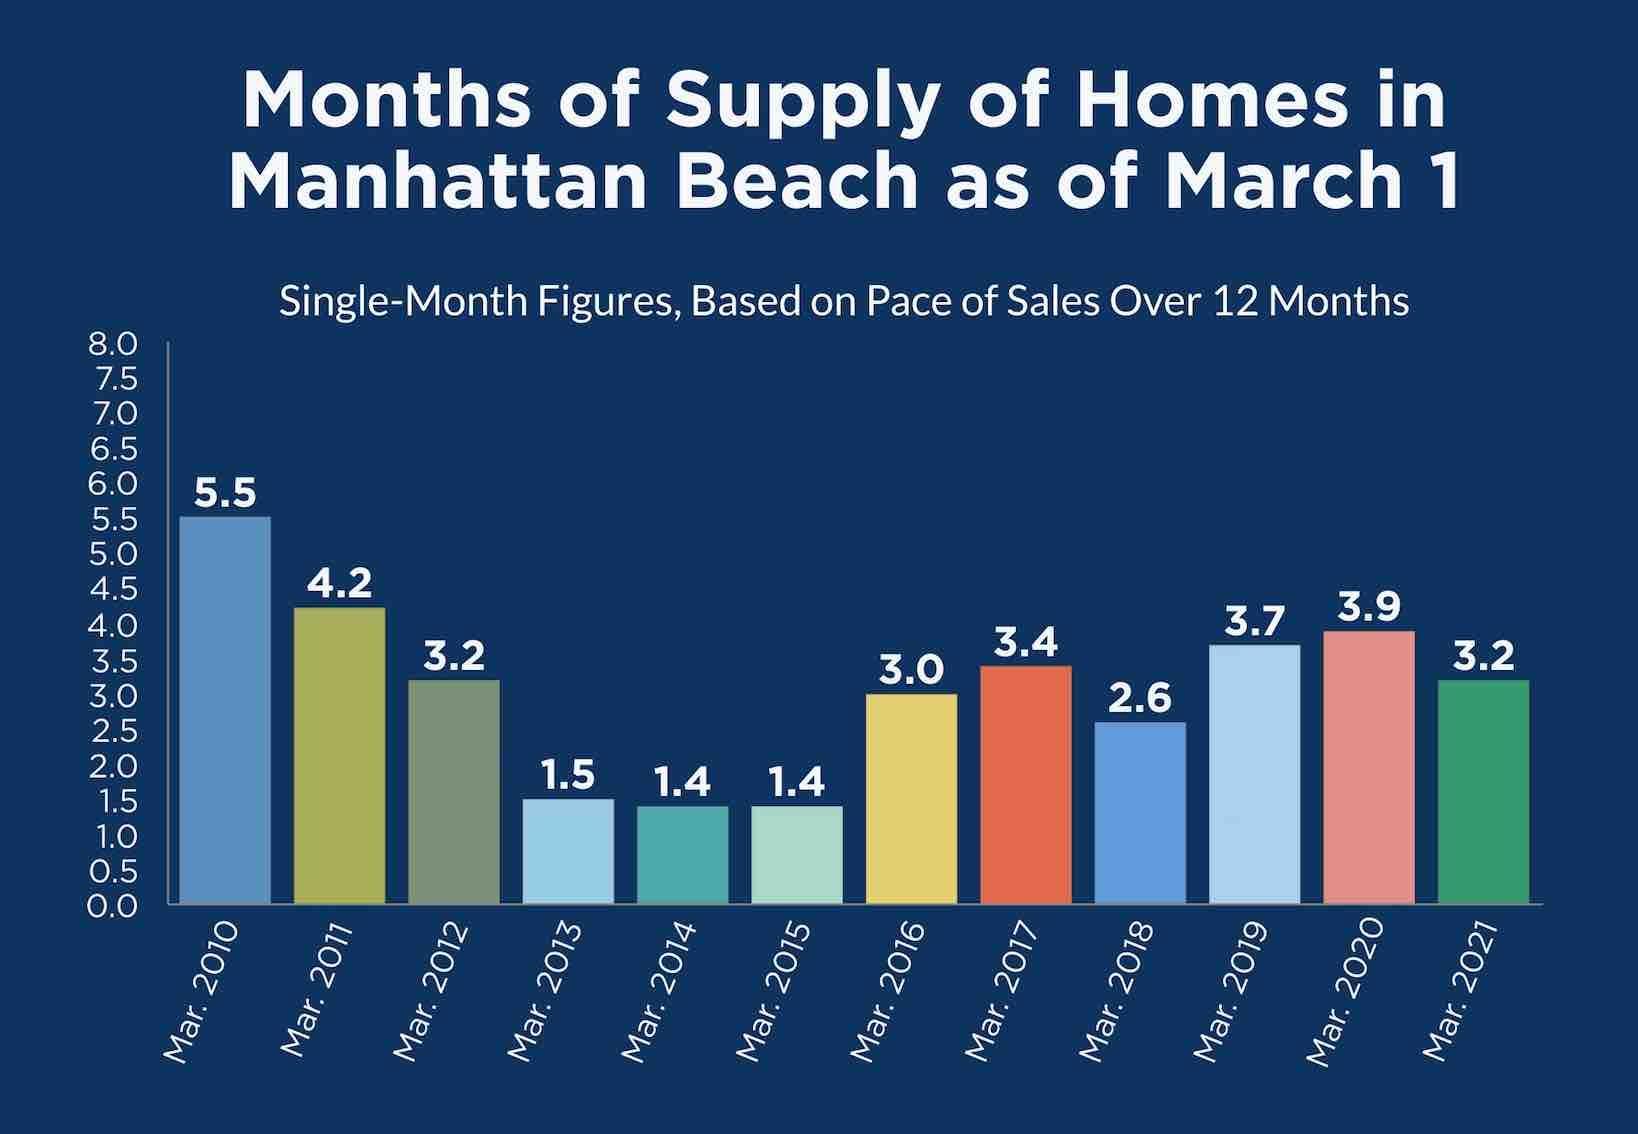 We begin March now with a substantially lower figure for months of supply than at this time in 2020, at 3.2 months. Last year was at 3.9 months.
Months of supply calculates current inventory and the pace of new escrows to come up with an estimate for how long it would take, hypothetically, to sell every home that's on the market today.
Our new chart here compares months of supply figures for an equivalent point, the first of March, going back 12 years to 2010. (You don't want to see 2008-2009, they're ugly.)
You'll see that 2021's March 1 figure is 2nd-best of the past 5 years, and best of the past 3 years.
More on how we got here in a moment.
In previous years and decades, a "months of supply" figure of 6.0 or higher was taken as a sign of a buyer's market.
That's really not a figure that's commonly reached in markets like ours, nor in times like ours.
A months-of-supply figure of 4.0 or higher, instead, is more commonly read as a buyer's market signal, due to the internet-quickened sale and purchase process.
(Imagine that: Back when fuddy-duddy real estate brokers tried to control all the supply and real estate information, it took longer to sell a house, and only brokers were better off. Hmmmph.)
Why does this year start better than recent years?
Inventory is only part of the story. Last year, there were 93 listings, this year, 82 listings as of the end of February.
The real story is in trend data stretching further back.
Months of supply is calculated using the prior 12-months' pace of new escrows opening. The idea is to smooth out seasonal or monthly differences and figure out how a consistent trend is pushing.
Well well. Here's a trend for you:
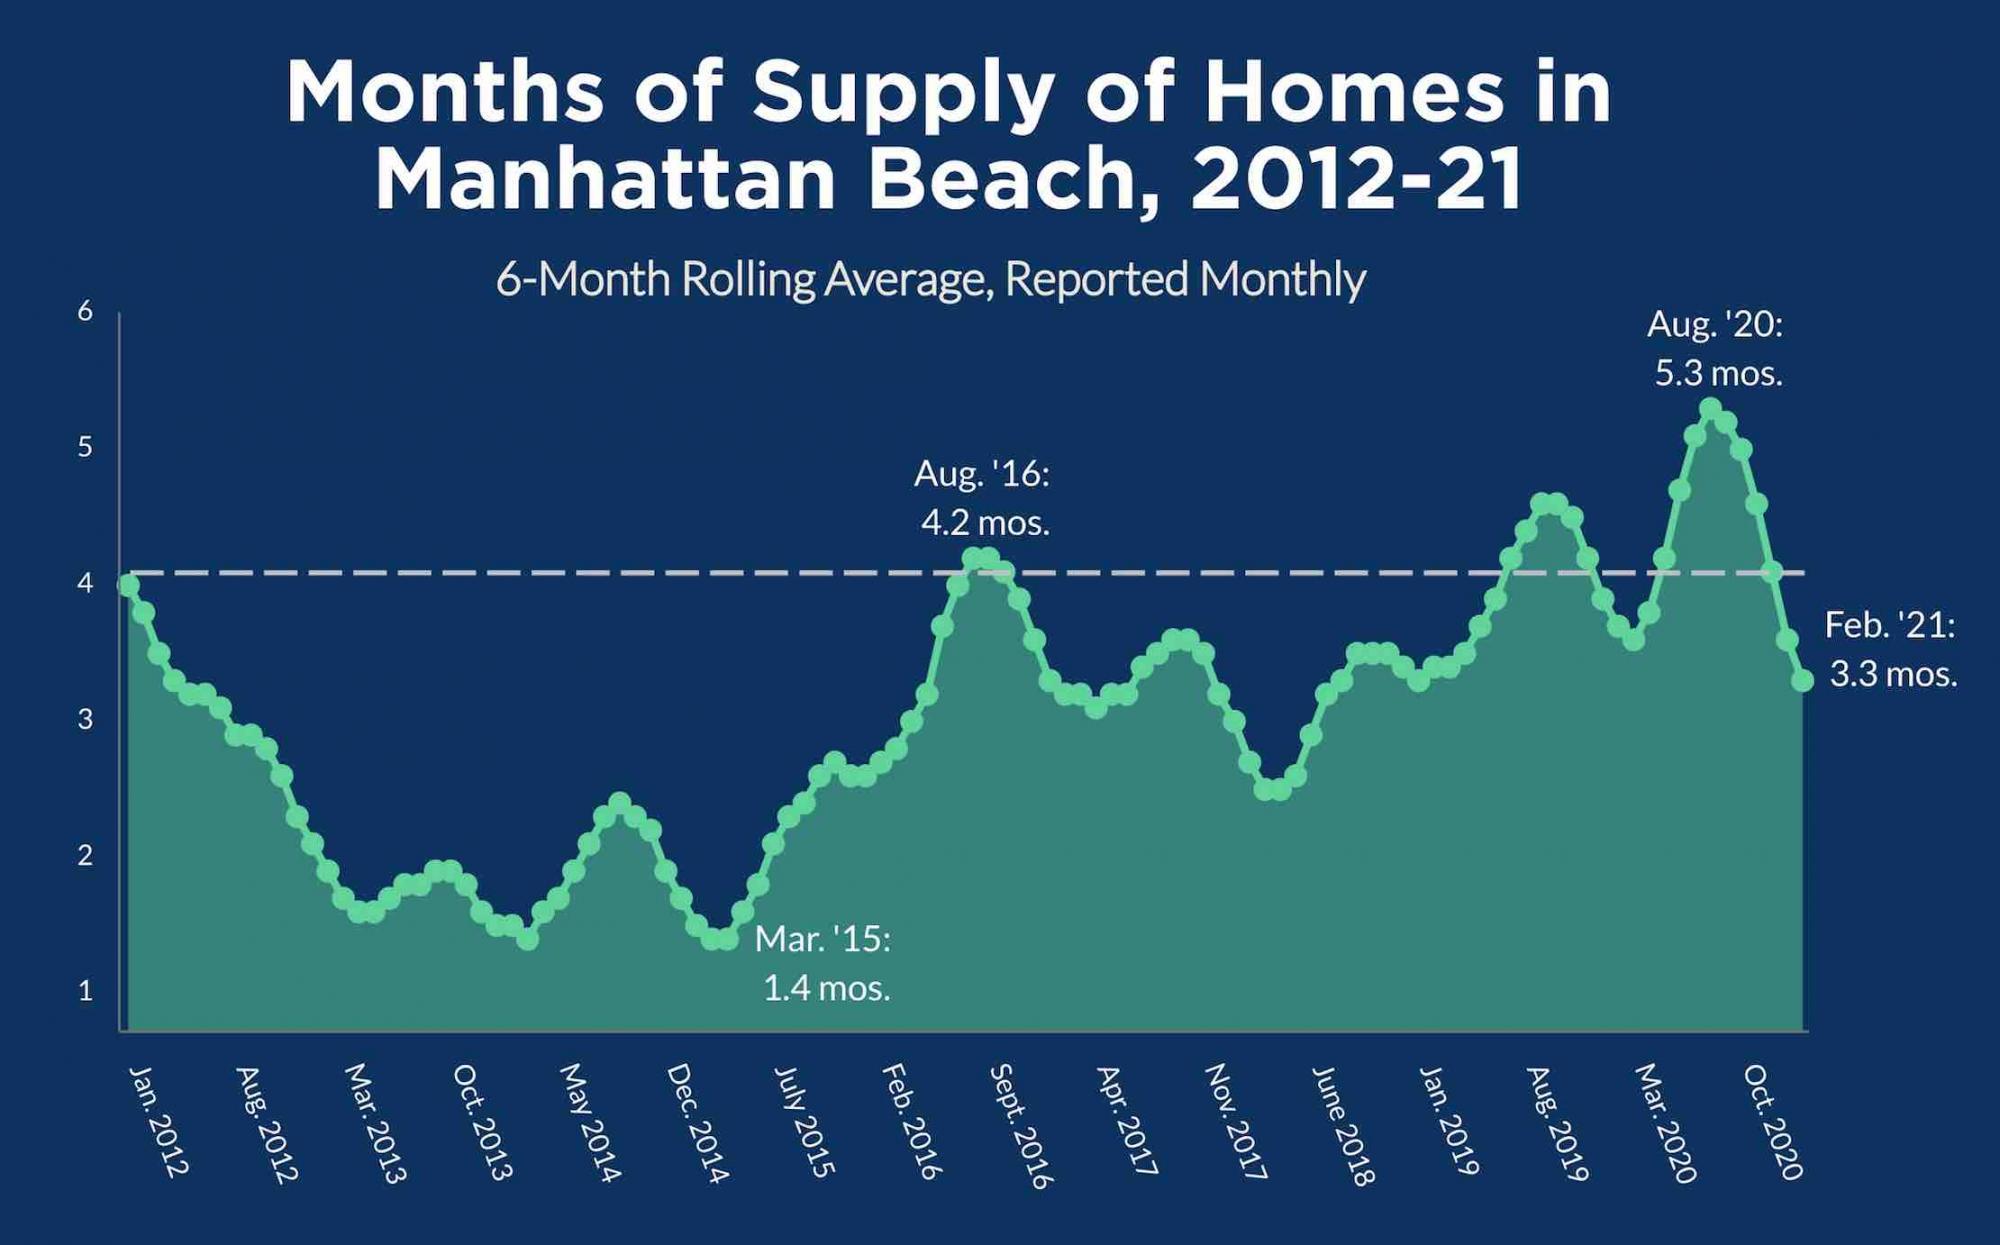
You see how nasty things got in the trend by August last year, reaching 5.3 months of supply.
Now, that scary peak was mostly a result of anemic sales in March-May 2020, during the shutdown months. That ruined the 12-month escrow pace that's used in the calculation.
Ruined it temporarily. What went up, had to come down.
A double-black-diamond downslope in the trend for months of supply began right after. The drop came in large in part due to a "blistering" Summer sales pace, as referenced in this post, for instance, as well as busy months that followed.
To see months of supply drop so speedily and to one of the lowest points in 3 years already, now, before the Spring market kicks off, suggests that there's a ways down to go with this measure.
(Nerdy note: In the first chart, we post monthly data, while in the larger, second chart, we averaged 6 months' worth of monthly figures for a smoother chart. This is why the end-of-February/first-of-March figure is 3.2 in one chart and 3.3 in the other.)
If we have a "normal" Spring, through May/June 2021, the slowest parts of the early-COVID dataset will drop out, and the blistering sales pace of the last several months will predominate as we calculate this figure again later.
Now, we mostly don't predict or gamble, as both activities are kinda stupid.
But we'll go out on a limb here and guess that by mid-year, 2021 will see the lowest months of supply figure since March/April 2018 (2.5 months), and the year's data could become competitive with mid-year 2015, when the figure got under 2 for a while, due to a hot-hot-hot 2014 and Spring 2015.
We'll try to come back to this figure later and see if we were right to try predicting.
Here's the rest of our local real estate market update report for the period ending 2/28/21:
> 82 active listings as of 2/28/21 (-5 from 2/15/21)
> 59 SFRs (flat)
> 23 THs (-5)
See the Inventory list as of 2/28/21 here, or see the MB Dashboard for up-to-the-minute data.
Active listings by region of Manhattan Beach in this report:
> Tree Section: 15 actives (-2)
> Sand Section: 43 actives (-3)
> Hill Section: 5 actives (+1)
> East MB: 19 (-1)
We're also providing a report on closed sales by region of MB.
Sales data, including PPSF for all properties, are organized by sub-region of Manhattan Beach.
Here's a link to the spreadsheet: "MB Pending/Sold as of 2/28/21".
Please see our blog disclaimer.
Listings presented above are supplied via the MLS and are brokered by a variety of agents and firms, not Dave Fratello or Edge Real Estate Agency, unless so stated with the listing. Images and links to properties above lead to a full MLS display of information, including home details, lot size, all photos, and listing broker and agent information and contact information.


