Does it seem like sales are happening fast?
Yes.
Does it seem like inventory can't keep up?
Yes.
And here's the proof.
Inventory isn't just down from last year, the first time we'd seen a global pandemic freeze the Manhattan Beach real estate market.
Today's inventory is at the lowest point…
Does it seem like sales are happening fast?
Yes.
Does it seem like inventory can't keep up?
Yes.
And here's the proof.
Inventory isn't just down from last year, the first time we'd seen a global pandemic freeze the Manhattan Beach real estate market.
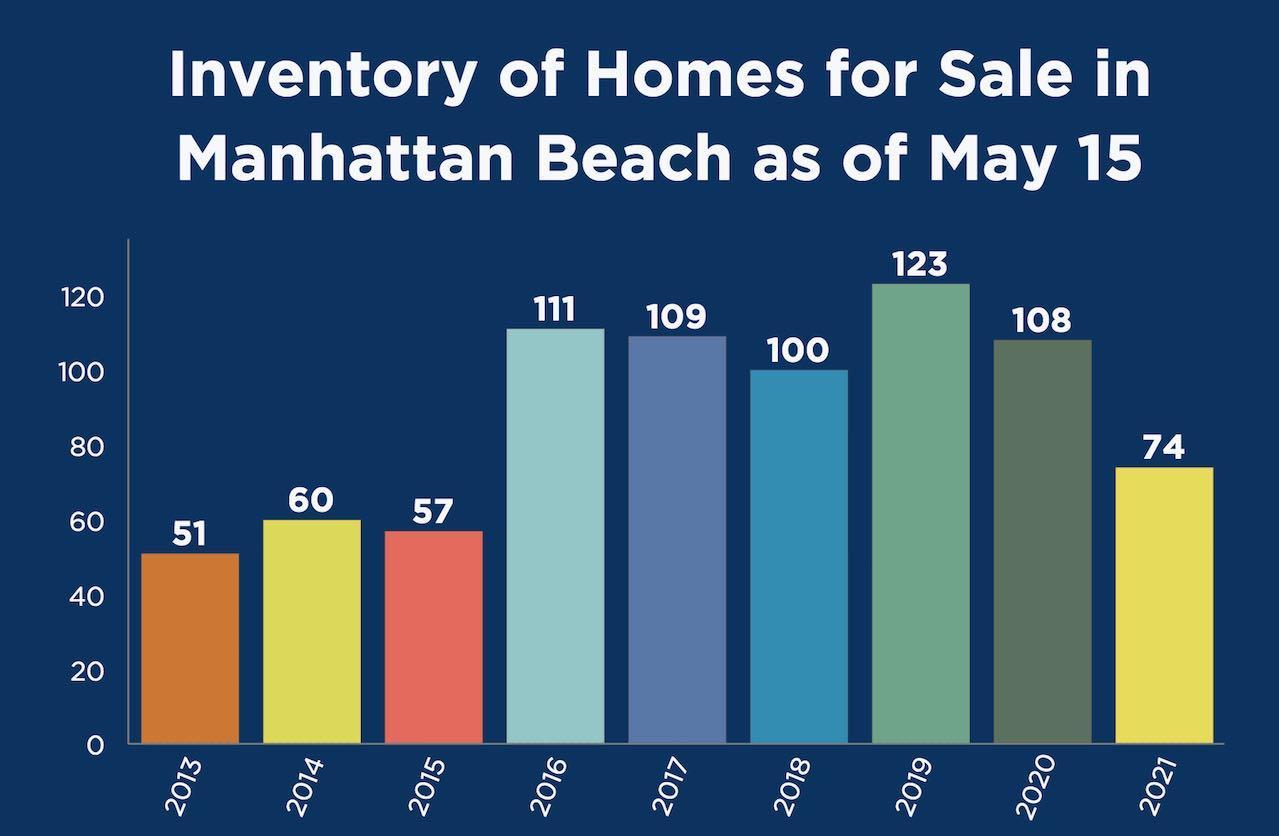
Today's inventory is at the lowest point for mid-May in 6 years.
Only the boomlet years of 2013-15 saw lower inventory than this year's 74 active listings as of May 15.
(All data here come from our regularly published twice-monthly MB Market Updates.)
And it's not like no one is listing! We get 12-20 listings a week here in the heat of Spring.
They're just selling faster.
A common measure we can access to look at the pace of sales is the median DOM for new listings that go under contract. It was the lowest for any recent year at month-end April 2021:
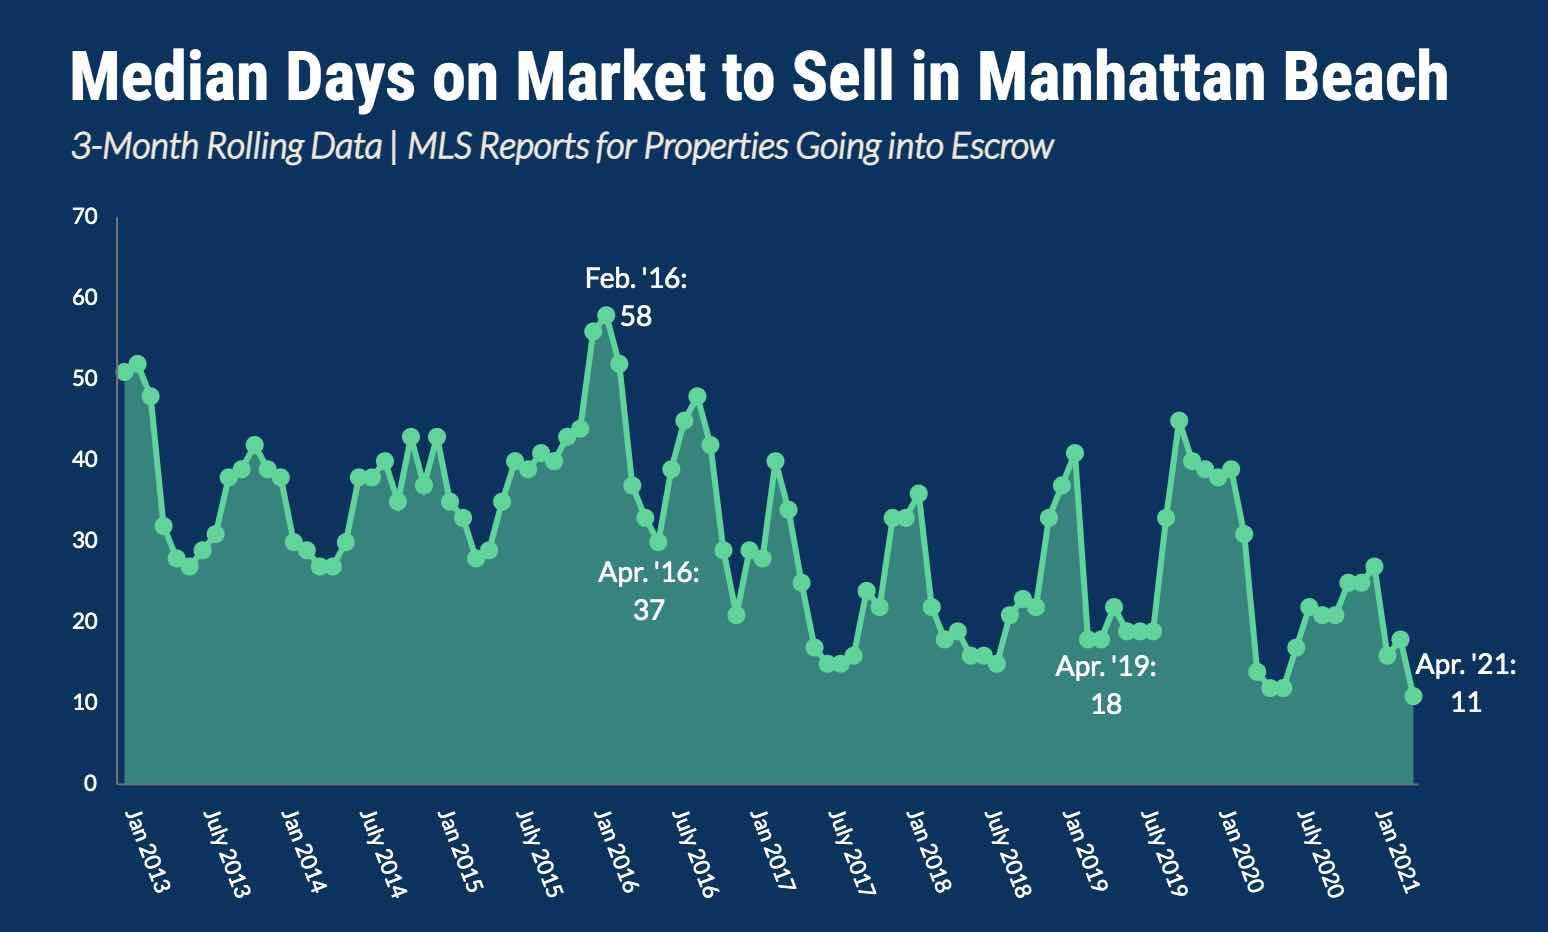
That's right, for the past 3 months (Feb.-April, inclusive), the median ("typical") Days on Market for a home to get into escrow was just 11 DOM.
That's a week faster than in 2019, and 26 days faster than in 2016.
In fact, it's the very lowest point ever hit for median DOM since early 2008, when our data set begins. We simply crafted this chart to begin at 2013 to reflect boom years, to try not to distract with the huge DOM figures from slumpy times.
Moreover, if we go by single-month data, April 2021's figure is also the lowest... just 7 DOM (median) to get under contract for those homes that did go under contract.
That monthly figure has almost always remained over 20 median DOM all the way back to 2008.
These are remarkable demonstrations of the high level of demand currently operating in the market.
Recent Sales
During our twice-monthly roundups, we always like to look at notable recent sales.
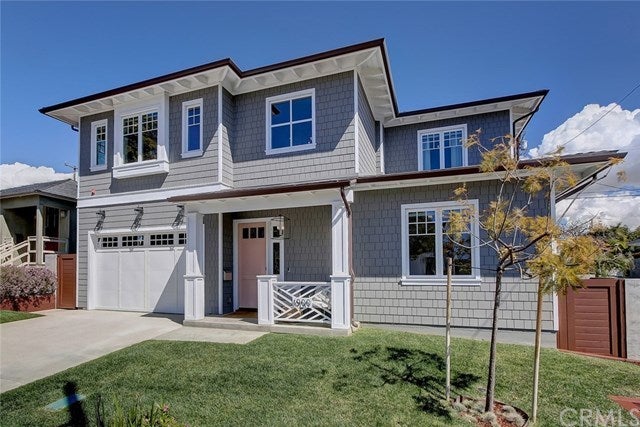 We've got to start with Dave's and Edge's listing at 1900 Lynngrove (5br/6ba, 3525 sqft.).
As we noted recently in recapping some East Manhattan sales, this 2019-built, like-new home boasts a ~5800 sqft. lot, on a favorable corner, with a large, sunny backyard. It's also got a unique feature of a separate outbuilding with 3/4 bath, a versatile bonus room that can be an office, home gym, pool cabana, or... ?
This home sold new in 2019 as the highest-ever sale in Liberty Village at $3.125M. We listed it this year at $3.299M and sold it higher with multiple offers, at $3.320M.
We had told our clients early this year that the way the market was shaping up, and given the hunger among buyers for a product like this, we could reach that record-breaking $3.3 number and perhaps do a little better. As we did.
And then the market radically upshifted immediately after. (See "Middle-3s for East MB New Construx.")
 Notable in the Tree Section: 3212 Maple (5br/5ba, 3440 sqft.), which had tried for a bit in late 2020, came out this year at $3.199M and lost an escrow, roared back and sold $101K over asking at $3.300M. (There's that number again.)
Meantime, in a sub-category of Tree Section homes, in this case a mid-1980s house with substantial upgrades, 1724 Walnut (4br/3ba, 3324 sqft.) sold quickly with multiple offers, getting overbid by $25K to $2.920M.
It was one of three out of 4 sales in the Tree Section to go over asking during this period.
Not so long ago, an 80s or 90s remodel in a decent location in the Trees would probably settle in the 2.7s. But here we are.
And yet, has the whole market rocketed?
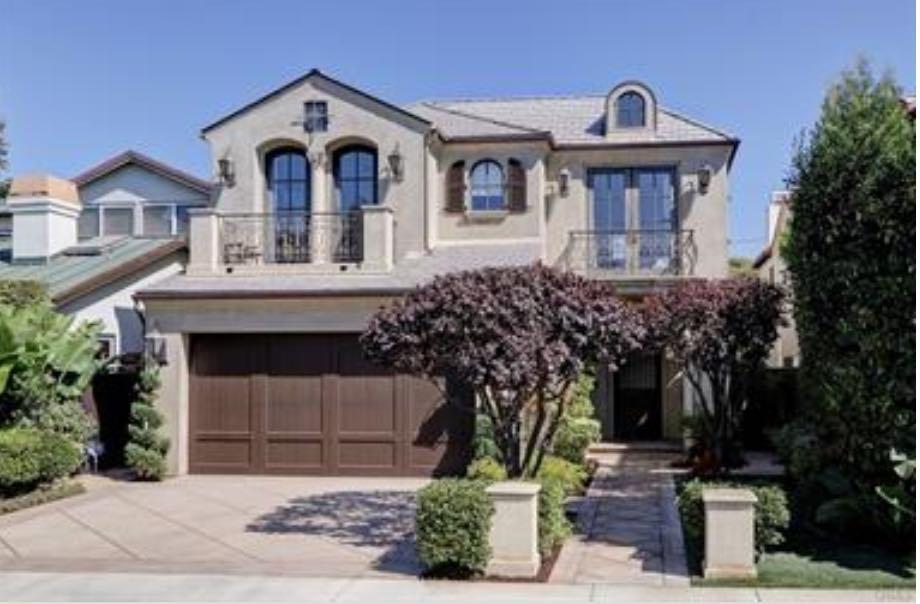
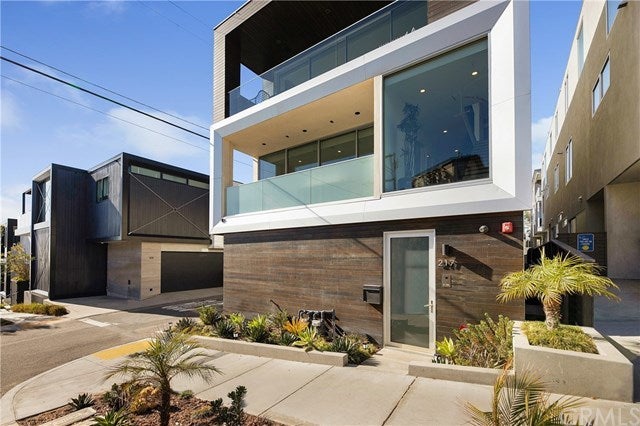 The newer modern townhome at 217 1st St. (3br/4ba, 1900 sqft.) recently sold for $4.000M.
But the sellers paid $3.912M just 2 years ago, meaning they didn't profit from the resale due to typical costs of sale.
And they didn't get the $4.199M they were originally asking.
That was just one of 5 sales in the Sand Section this period (May 1-15), all of which sold under asking.
Under asking?
Maybe it's just a quirk.
Here's the rest of our local real estate market update report for the period ending 5/15/21:
> 74 active listings as of 5/15/21 (-9 from 4/30/21)
> 49 SFRs (-8)
> 25 THs (-1)
See the Inventory list as of 5/15/21 here, or see the MB Dashboard for up-to-the-minute data.
Active listings by region of Manhattan Beach in this report:
> Tree Section: 18 actives (+1)
> Sand Section: 35 actives (-4)
> Hill Section: 6 actives (-3)
> East MB: 15 (-3)
We're also providing a report on closed sales by region of MB.
Sales data, including PPSF for all properties, are organized by sub-region of Manhattan Beach.
Here's a link to the spreadsheet: "MB Pending/Sold as of 5/15/21".
Please see our blog disclaimer.
Listings presented above are supplied via the MLS and are brokered by a variety of agents and firms, not Dave Fratello or Edge Real Estate Agency, unless so stated with the listing. Images and links to properties above lead to a full MLS display of information, including home details, lot size, all photos, and listing broker and agent information and contact information.


