Have you noticed fewer bidding wars these days?
Fewer cases of properties selling above their asking prices?
We respect the MBC audience as a savvy group, so we'll guess that you have noticed. If you've had a finger in the wind, you probably have observed that prices aren't always going up and up and up.
…
Have you noticed fewer bidding wars these days?
Fewer cases of properties selling above their asking prices?
We respect the MBC audience as a savvy group, so we'll guess that you have noticed. If you've had a finger in the wind, you probably have observed that prices aren't always going up and up and up.
Now we have some data to back up that sense of a gradually cooling market.
Don't worry, it's not going to cause a panic.
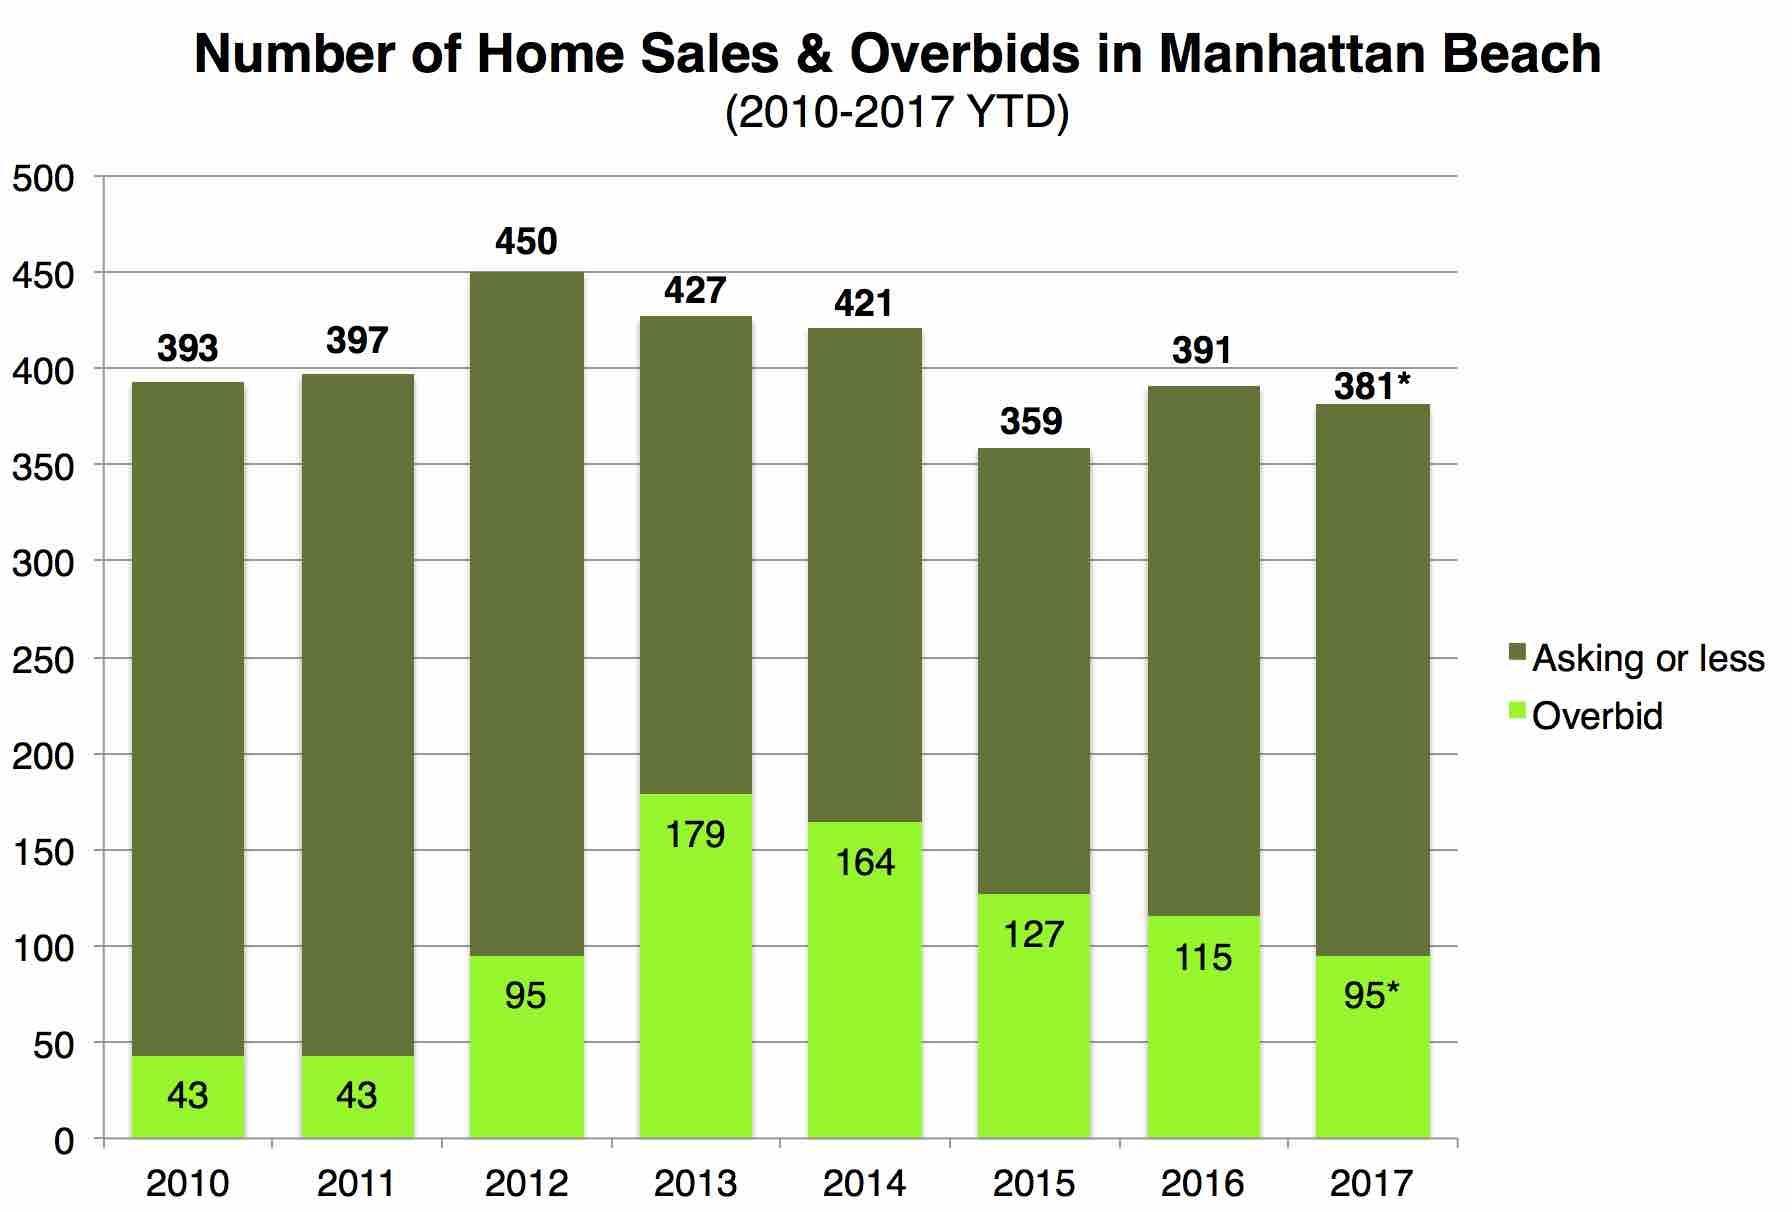 We looked at 8 years' worth of data on MLS-reported sales, and found data that match very well with our recollections from working in this market over the past several years.
In 2010-11, while tumbleweeds blew across the Manhattan Beach landscape, just 43 out of about 400 sales each year closed higher than asking price.
By 2012, the pace of overbids picked up, as did the overall sales pace.
Out of 450 sales that year, 95 (or 21%) were overbids.
And then, up it went, like a rocket. In 2013, a much larger number (179) of home sales closed above asking, making up 42% of real estate sales in Manhattan Beach. These were both highs for the past 8 years.
Though the pace fell a bit in 2014, you can see that for both 2013 and 2014, if you put a home on the market, however you priced it, you had a pretty good chance of seeing offers come in higher.
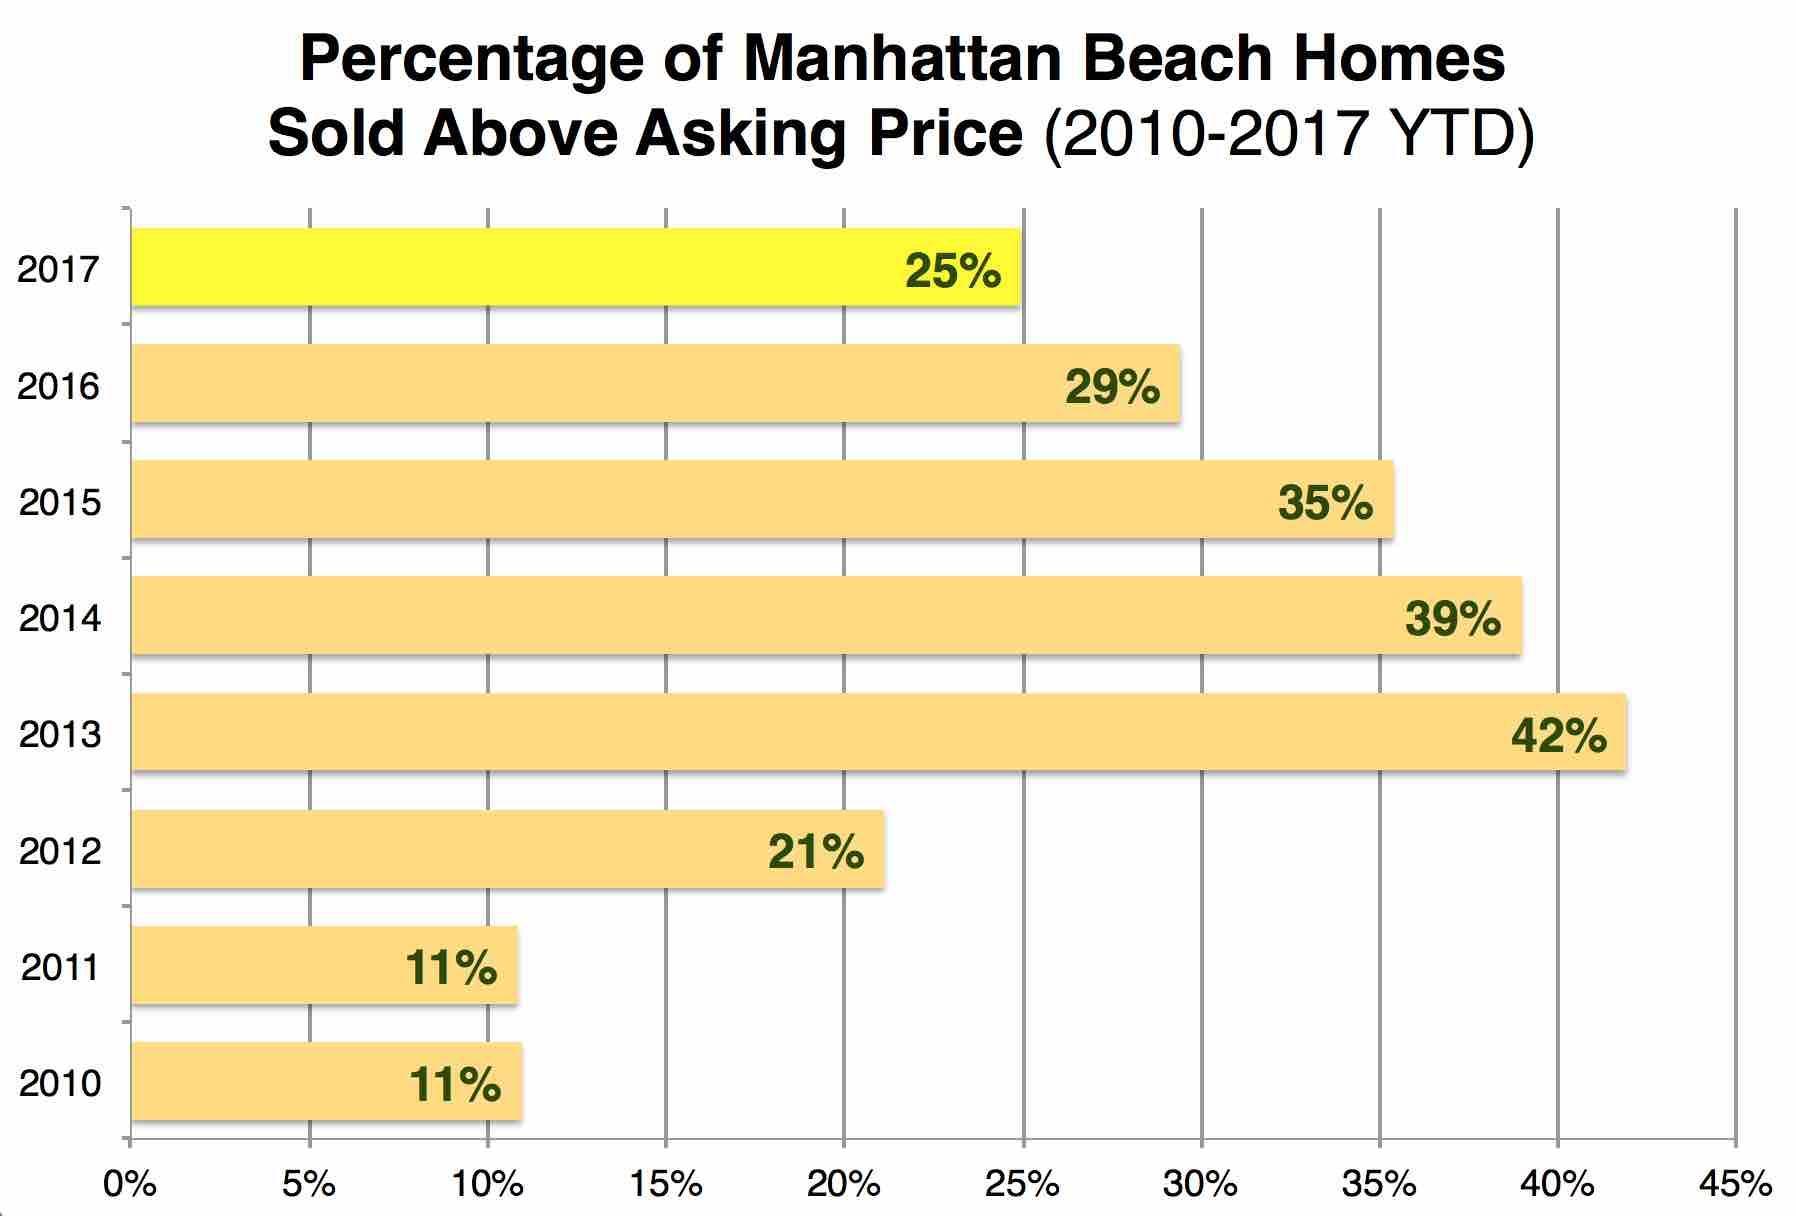 There is a gradual dropoff in the number and percentage of overbids each year, from 2015-2017 (year to date), indicating that the market began calming or cooling over this time. Buyers weren't always rushing to pay more. In fact, they are often paying quite a bit less than the start price.
Want a surprise? We found it illuminating that nearly 100 of the almost 400 sales so far in 2017 have been overbids.
We're posting on November 21, so there are 5-6 weeks left to get final data. But it looks like we won't see a great reduction in overbids from 2016, and the overall percentage of overbids in the market will still be higher than 2010-2012.
What were some of those overbids in 2017? A selection:
Sand Section
 472 28th (4br/4ba, 2600 sqft.) closed for $2.580M, $81K over asking.
3100 Alma (3br/4ba, 2400 sqft.) closed for $3.100M, $101K over asking.
411 Crest (3br/4ba, 2100 sqft.) closed for $2.300M, $51K over asking.
212 40th (3br/2ba, 1520 sqft.) closed for $1.800M, a token $1,000 over asking.
Tree Section
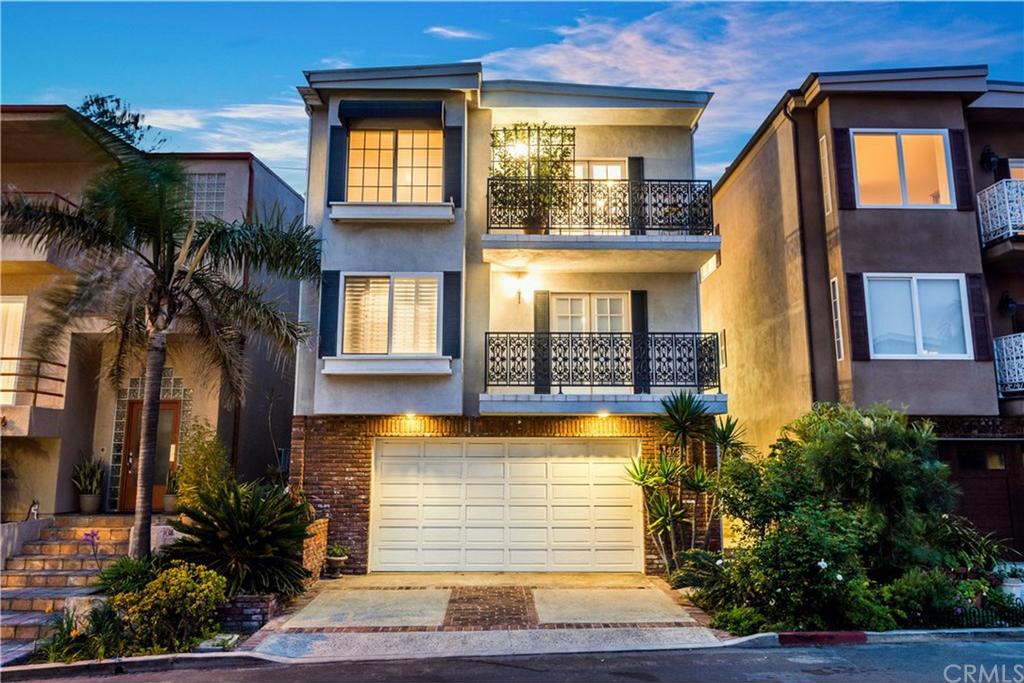
 657 19th (4br/4ba, 3025 sqft.) closed for $2.650M, $51K over asking.
3513 Elm (4br/2ba, 1300 sqft.) closed for $1.540M, a whopping $455K over asking.
3309 Pine (3br/2ba, 1500 sqft.) closed for $1.525M, $125K over asking.
2901 Blanche (5br/5ba, 3350 sqft.) closed for $3.225M, $26K over asking.
Hill Section
 927 N Dianthus (4br/3ba, 3750 sqft.) sold for $2.900M, $151K over asking.
712 Manhattan Beach Blvd. (3br/3ba, 1675 sqft.) sold for $1.675M, $36K over asking.
512 Pacific (lot sale, 11,400 sqft.) sold for $6.100M, $101K over asking. (It first sold for $5.500M in Feb. 2016.)
East Manhattan
 1407 23rd (4br/2ba, 2000 sqft.) closed for $2.010M, $85K over asking.
1461 12th, Unit C (3br/3ba 1750 sqft.) closed for $1.160M, $61K over asking.
1623 5th (5br/6ba, 4400 sqft.) closed for $2.826M, $131K over asking.
As to our data methodology, let's stipulate that MLS data on overbids aren't perfect. (There's no "perfect" in real estate!)
For instance, a property could get listed, fail to sell, re-list at a new price and with a new DOM count, then sell a bit over the new price. That would count as an overbid in this analysis, even if they sold under the very first start price from the first listing. The MLS records for sales are only showing us the sold price as compared with the most recent listing's price.
Also, different market conditions may cause sellers to price differently. So you can't necessarily compare the rate from one year to another without some idea of what sellers were usually thinking when they settled on a list price.
You hope that such concerns with the data would wash out over a longer time sequence like 8 years.
We came out of this analysis feeling that the data accurately describe the frenzy of late 2012 through mid-2015, and accurately suggest a cooling, more rational market now.
But we also came away thinking there's plenty of punch to the market as it stands today.
The year is going to end with more sales in Manhattan Beach than we've seen in any year since 2014. Yes, we have a bit of a supply overhang, but demand is still there, and overbids are still a thing.
Please see our blog disclaimer.
Listings presented above are supplied via the MLS and are brokered by a variety of agents and firms, not Dave Fratello or Edge Real Estate Agency, unless so stated with the listing. Images and links to properties above lead to a full MLS display of information, including home details, lot size, all photos, and listing broker and agent information and contact information.


