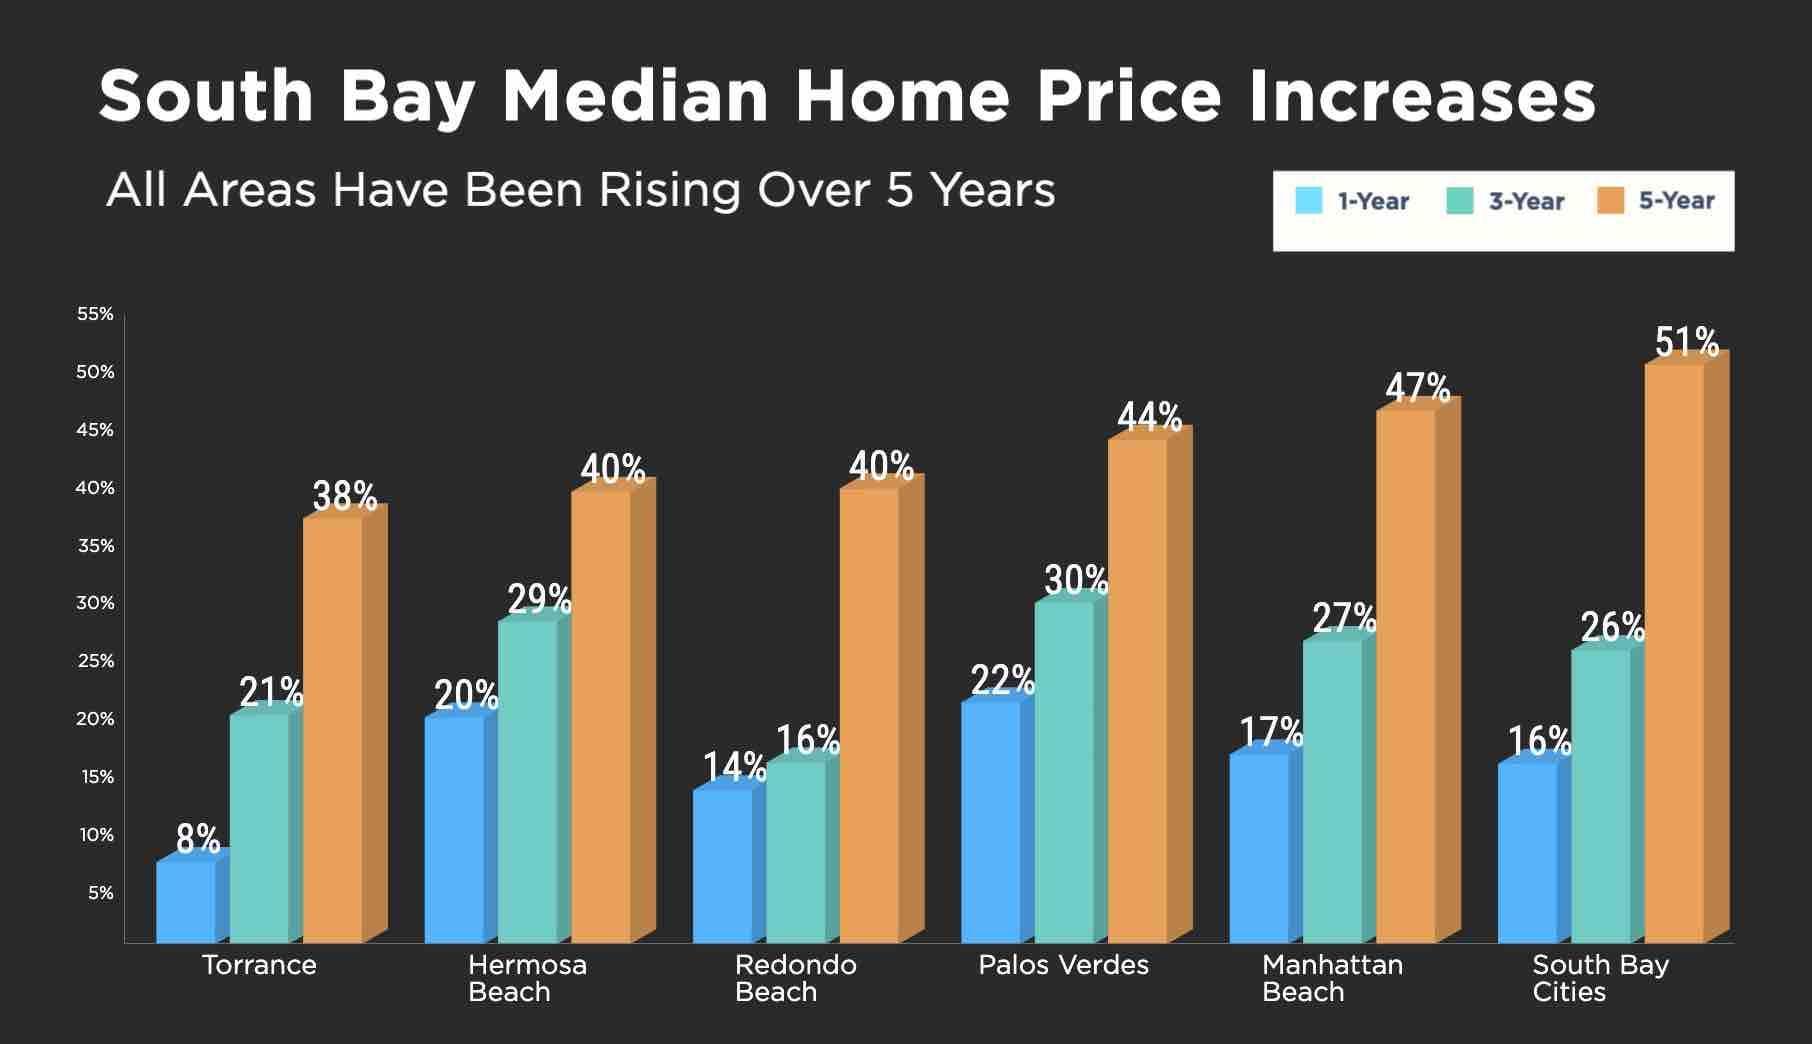
Over the past 5 years, Manhattan Beach median home prices have continued to reach ever-newer heights.
Now, in a big change from just one year ago, the city's pace of change for median home prices has also proved to be the greatest of all major South Bay areas over a 5-year period (2017-21).
This is…
Over the past 5 years, Manhattan Beach median home prices have continued to reach ever-newer heights.
Now, in a big change from just one year ago, the city's pace of change for median home prices has also proved to be the greatest of all major South Bay areas over a 5-year period (2017-21).
This is notable in part because, just one year ago, Manhattan Beach was showing the slowest growth in median prices over both a 3-year and 5-year period, and lagged the South Bay as a region. (See our similar post from March 2021 here.)
At $3.054M at year-end 2021, the median home price for Manhattan Beach had jumped $454K from only a year earlier. And that was $979K above the median price from 5 years prior.
That median price rise of 47% over 5 years beats the Palos Verdes area by 3%, and our neighboring beach cities (Redondo and Hermosa) by 7%. Torrance lags on the 5-year timeline by 9%.
The South Bay as a whole saw the median price rise by 51%, by $480K to $1.425M.
(We have defined the South Bay here as the three beach cities, Torrance and the whole Palos Verdes region. Some other cities also nearby are not included in this data.)
PV and Hermosa were year-over-year champs, with 22% and 20% median price rises, respectively, with Manhattan Beach clocking in third at 17% year-over-year.
Manhattan Beach also slipped barely behind PV and Hermosa on the 3-year timeline, with a median price jump here of 27% compared to 30% in PV and 29% in Hermosa.
On both the year-over-year and 3-year horizons, Manhattan Beach bested the whole South Bay region by 1%.
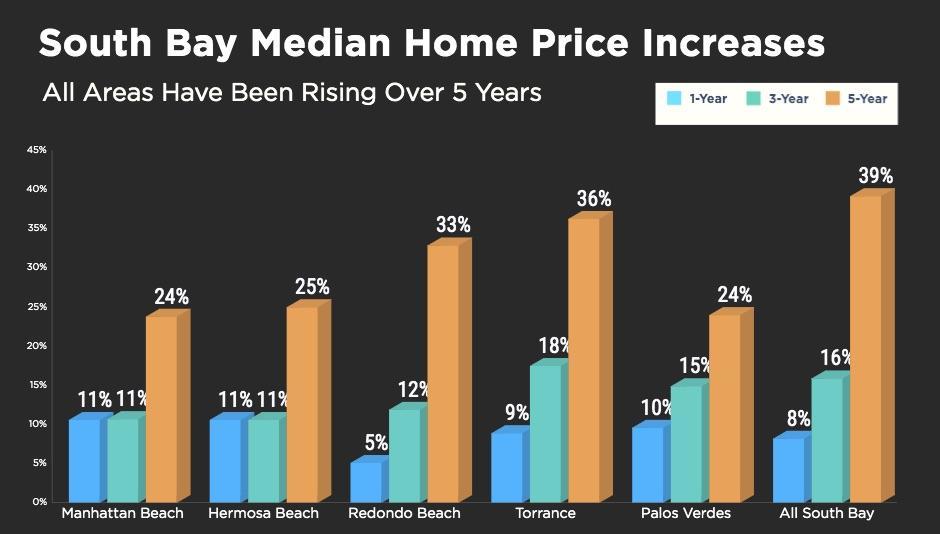 Here's last year's chart for a quick comparison.
Manhattan Beach was stuck at the far left of the chart with relatively flat 11% rises for the 1-year and 3-year periods, while the 5-year increase fell far behind Redondo, Torrance and the South Bay as a whole.
That was then.
What changed?
Obviously, we're looking at different data, one year more advanced. This includes two years of rapid price inflation just about everywhere, but especially in Manhattan Beach.
We take a starting point now of Dec. 2016, just before the 2017 runup, and the wobbly market of 2019 now fades a bit in the data.
It's also interesting to note that, last year, we saw Redondo and Torrance most closely matching the trends for the South Bay as a whole.
Now, it's Manhattan Beach's numbers that are closest to the aggregated figures for the South Bay.
We're adding one more chart, an update of one we produced last year.
This interactive chart displays the median prices for all of the cities and regions in this post. The chart allows you to "roll over" and spot the median prices at each point on the 5-year chart (2017-2021), for any of the cities or regions of the South Bay. (This feature only works on the website directly, not in email. See the post online here.)
Enjoy the chart:
#sbmedians21#
Please see our blog disclaimer.
Listings presented above are supplied via the MLS and are brokered by a variety of agents and firms, not Dave Fratello or Edge Real Estate Agency, unless so stated with the listing. Images and links to properties above lead to a full MLS display of information, including home details, lot size, all photos, and listing broker and agent information and contact information.


