We're looking back now to the second part of November, looking for data, trends and so forth.
One number will get your attention.
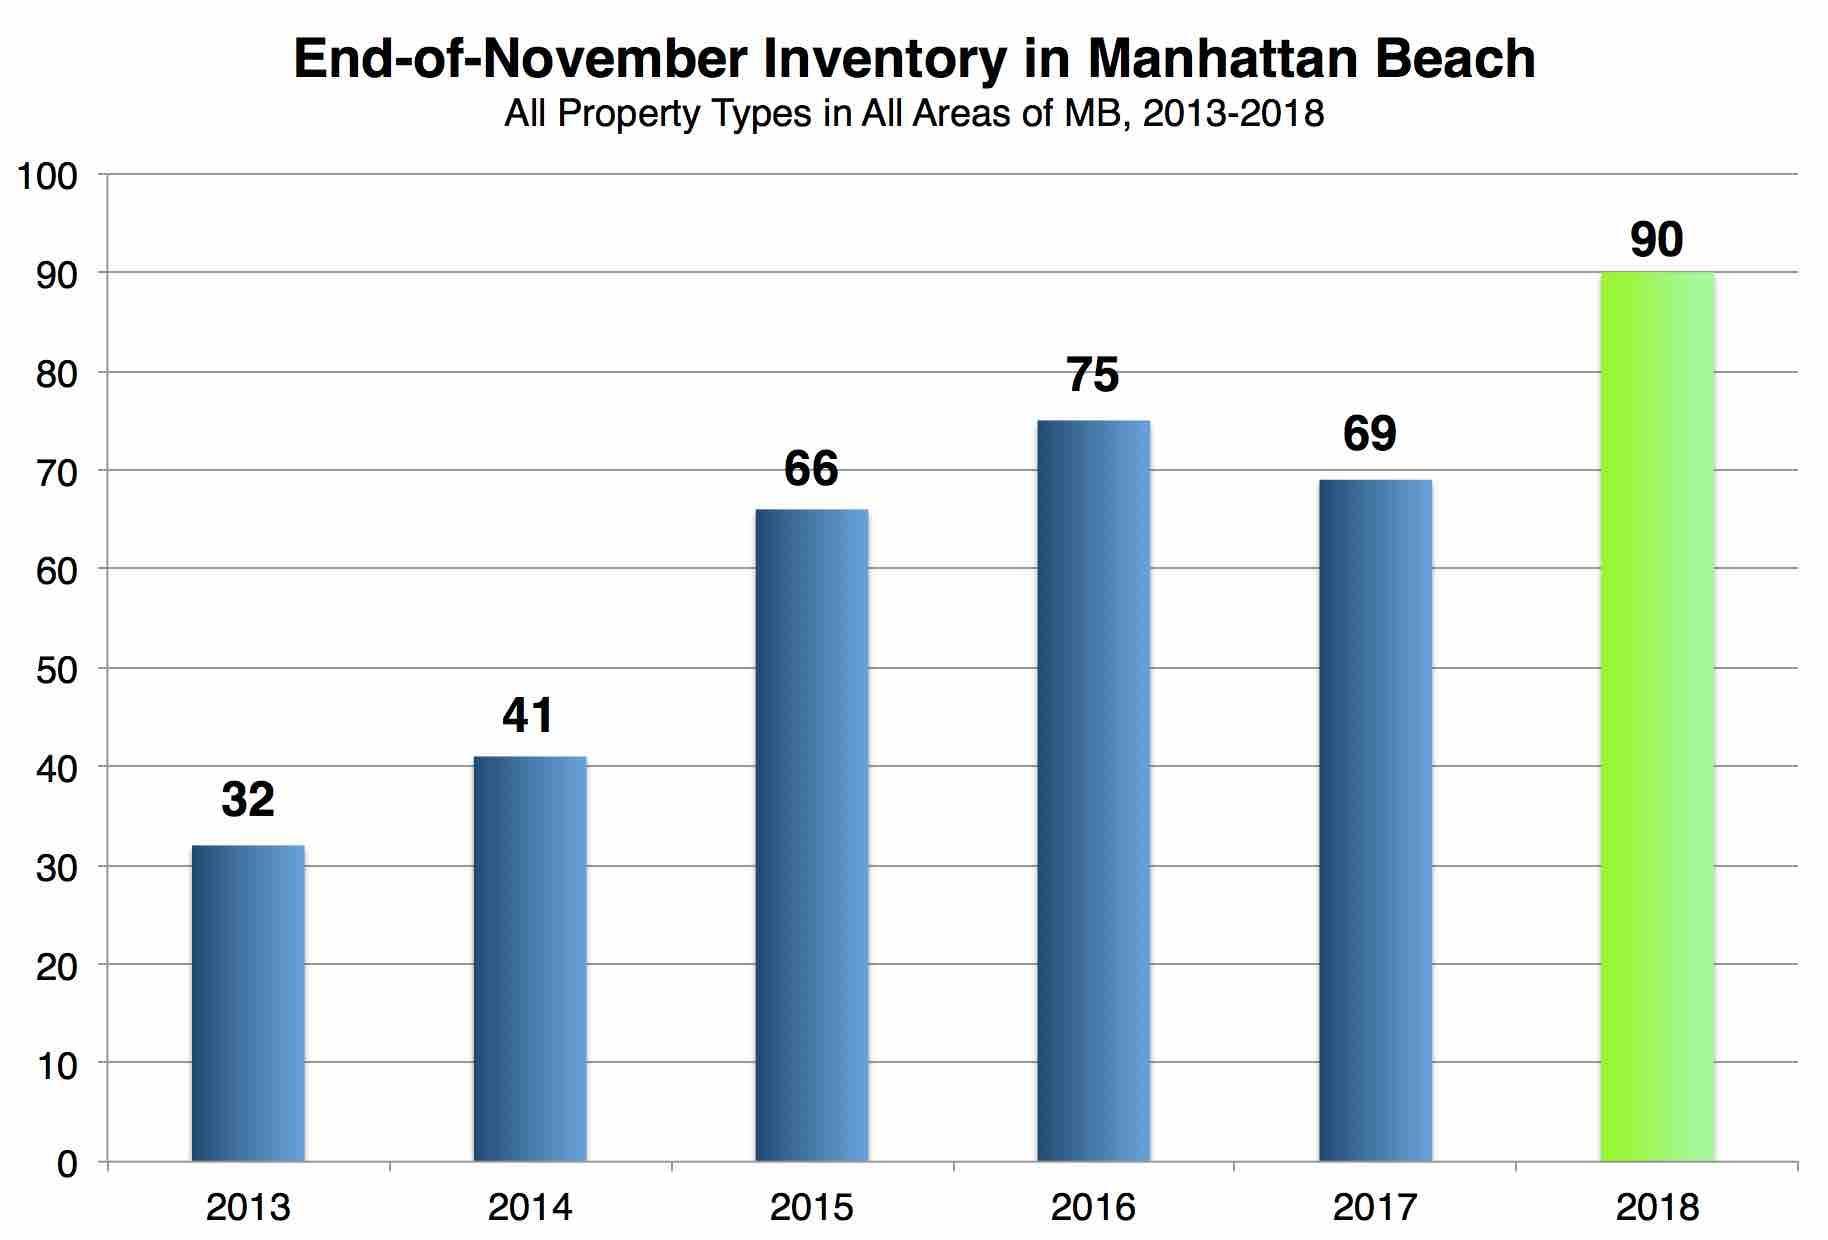 Inventory at the end of November was at 90 listings citywide in Manhattan Beach. This is 15 more than the recent high, 21 more than last year at this time.
This would seem to…
We're looking back now to the second part of November, looking for data, trends and so forth.
One number will get your attention.
Inventory at the end of November was at 90 listings citywide in Manhattan Beach. This is 15 more than the recent high, 21 more than last year at this time.
This would seem to count as evidence of the market slowing down in Q4 2018. Certainly, it's evidence of a change afoot.
This is one of the first data-based confirmations of the "buzz" in the market that we've reported here for weeks. (And that we've mostly failed to validate previously. But you might look back at "Housing Stats That Worry Experts" for some insights.)
If there are more homes out there now than at the same comparable point in prior years, that's also new for 2018.
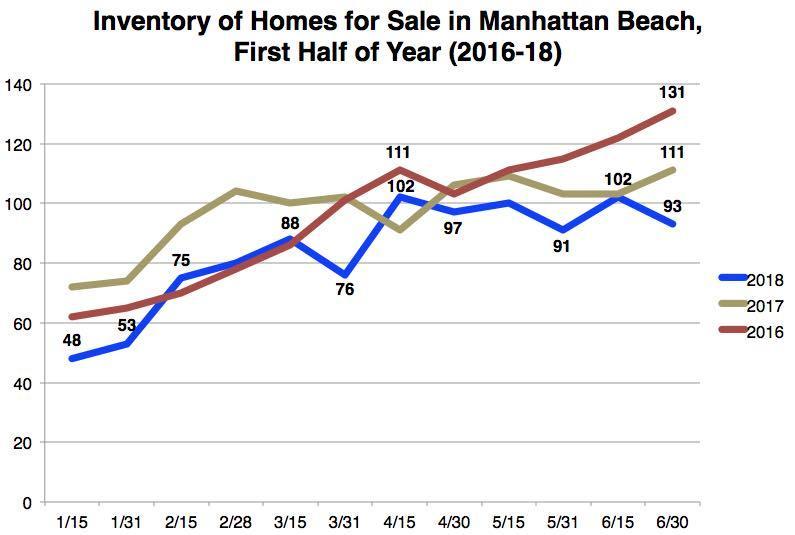 Midyear, we looked at inventory for 2016-18, and found that 2018 was trucking along with notably lower inventory than recent years. (Click here to read the whole midyear update.)
If we were lower then, but we're higher now, that might well be an indictment of sales activity in the second half of 2018.
Now, it could be more than a slower sales pace that explains higher inventory.
For example, we note that listings are on the market at a seller's discretion. Often by this time of year, many sellers roll up their listings to wait for Spring.
Maybe this year, more sellers are saying, essentially, "I'm going to try my luck with late 2018, 'cause I don't know what 2019 has got in store." They'd rather try now than wait, mainly out of uncertainty over the future.
Obviously, we'll keep watching these trends, and we'll look for more data and meaning along the way.
The next marker will be year-end inventory, which fell to only 41 listings on Dec. 31, 2017. You think we'll see 50 listings drop off between now and then?
Let's also take a look at some notable sales from the late-November period.
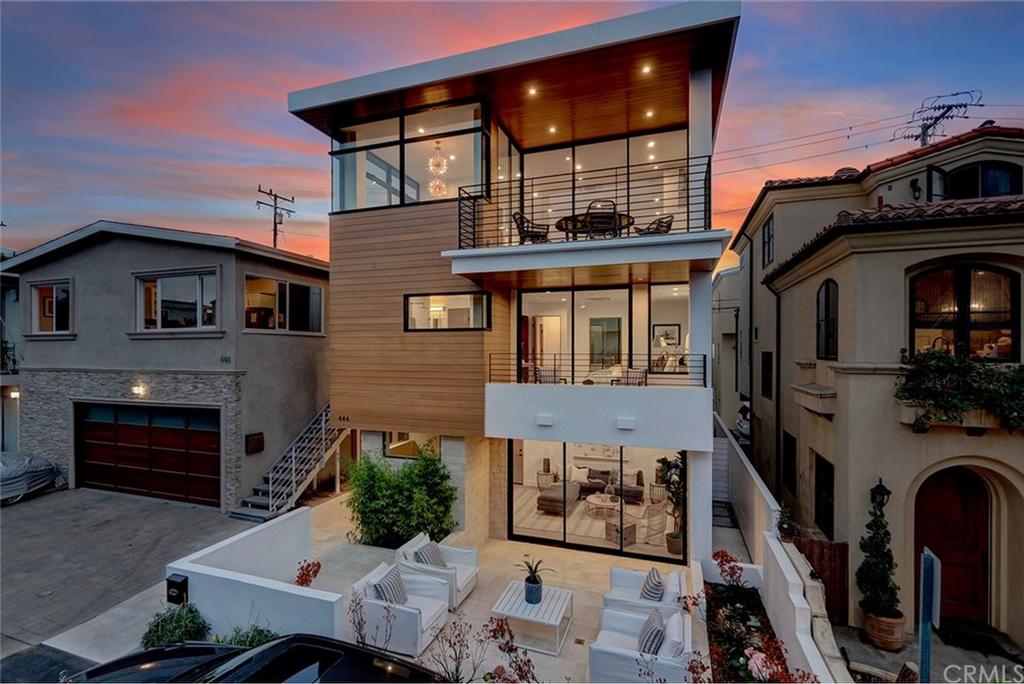 One was new construction on the plateau (aka "the flats") at 444 28th (3br/4ba, 2440 sqft.).
This new modern, with a front patio akin to a walkstreet home's, began at $3.399M and closed for $3.050M.
A new modern on the flats. Where did we see one of those recently?
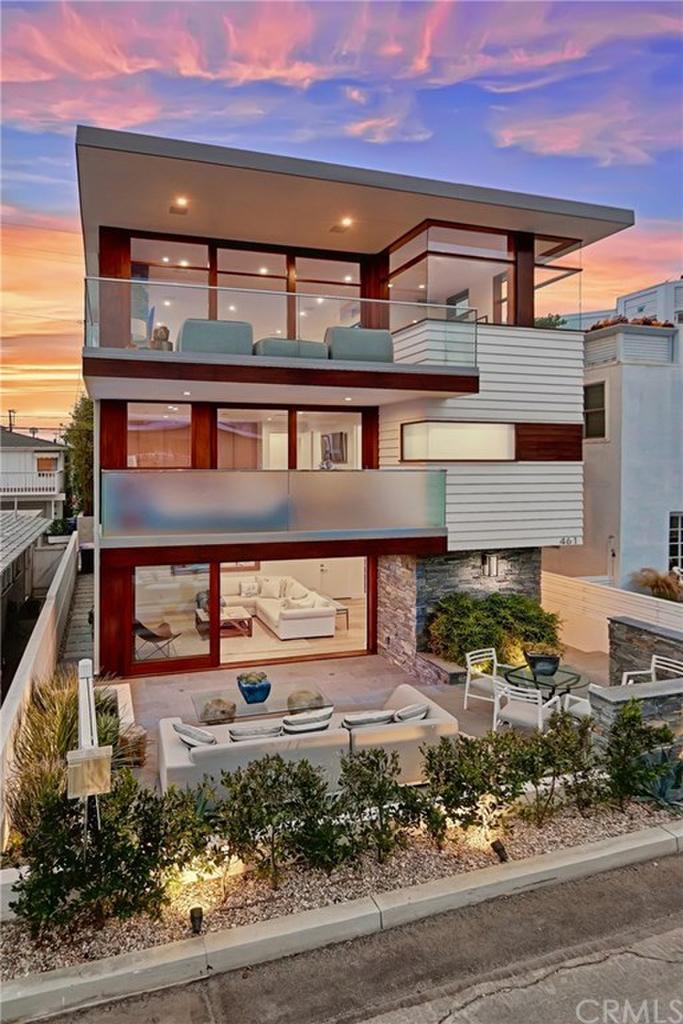 Right, it was 461 27th (3br/4ba, 2300 sqft.), a neighbor so close you could probably see it from 444 28th.
Mid-400 block - check.
3br - check.
New - check.
Modern - check.
Lot size 1549 sqft - check.
That's an awfully similar profile.
But in April, 461 27th closed for $3.295M, or $245K and 8% more. In April.
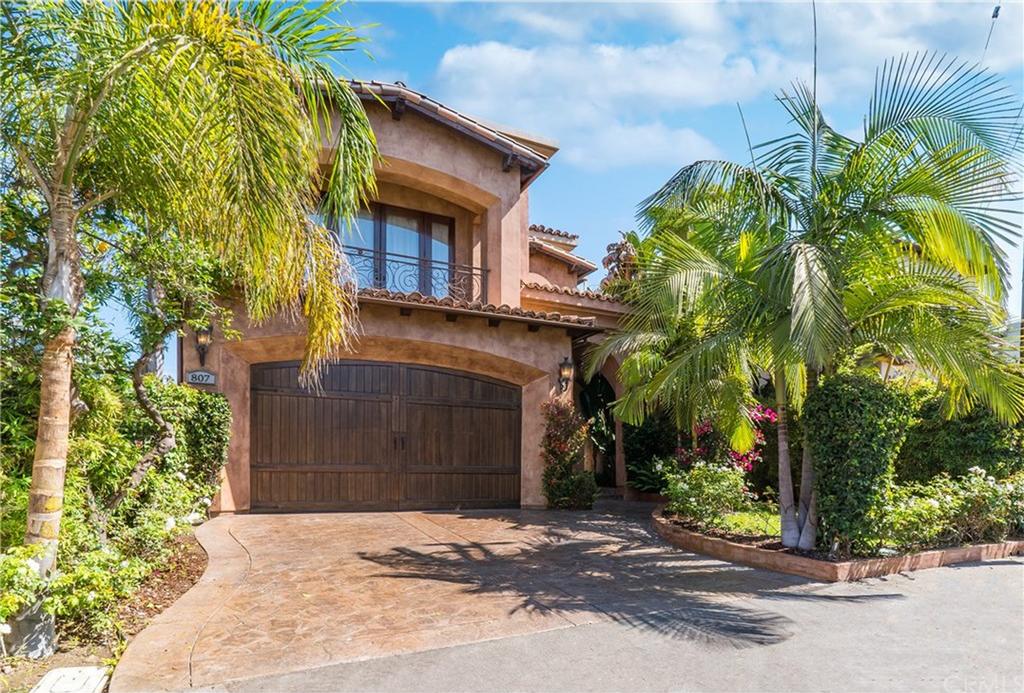 A newer Hill Section Mediterranean at 807 Boundary Place (5br/5ba, 3200 sqft.) has now closed for $2.750M.
This one first hit the market in early August at $2.995M, but canceled and re-listed twice more to try to refresh things and find a buyer.
Eventually, it worked - at a lower price.
Over in the Tree Section, there was a big sale at an oversized home on an oversized lot at 769 33rd (6br/5ba, 4900 sqft.).
The modern Spanish home came out at $5.200M, but closed for $4.800M.
And Dave's office closed 2 sales in this period. One was a listing at 848 12th Ct. (4br/4ba, 3250 sqft.) over asking at $2.950M. (See "Three Sales Over Asking" for more.)
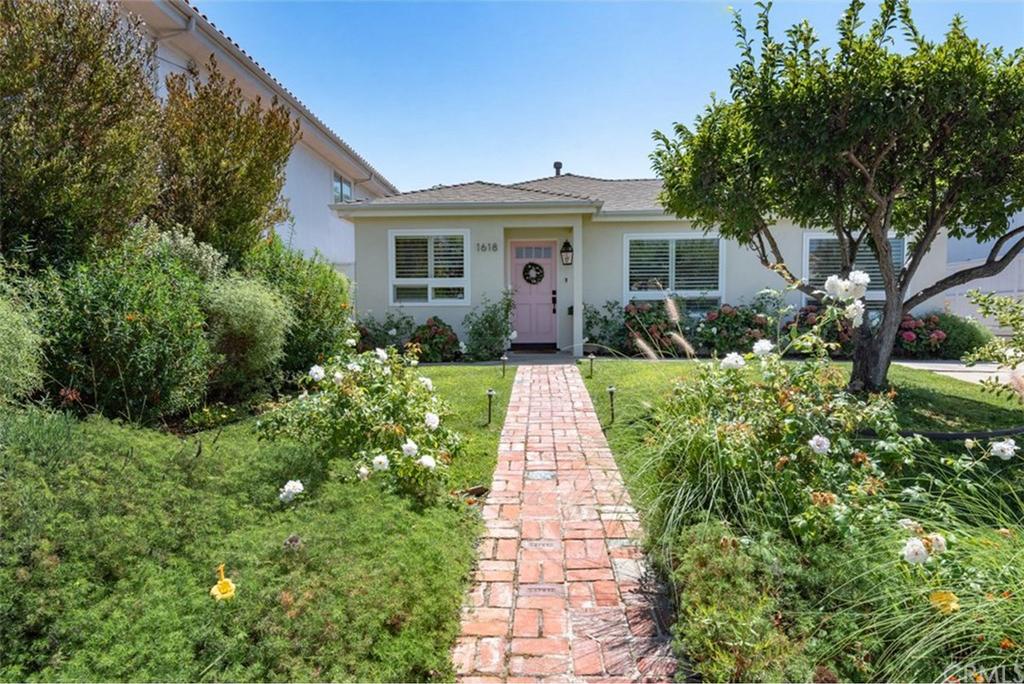 We also happily got buyer clients into a remodeled cottage in East Manhattan Beach at 1618 5th (3br/2ba, 1650 sqft.) with a large yard and pool. The sale closed for $2.015M.
That sale was also the linchpin of, apparently, 5 separate sales. Several parties were selling one thing to buy another. This one purchase got all the others rolling.
(Editor's note: We make this blog about all Manhattan Beach real estate. We don't focus too much on Dave's business as a local broker. But y'know, it is how we keep the lights on and have the freedom to publish a nice website. So we hope you'll understand and appreciate the references once in a while!)
Here's the rest of our local real estate market update report for the period ending 11/30/18:
- 90 active listings as of 11/30/18 (-9 from 11/15/18)
- 69 SFRs (flat)
- 21 THs (-9)
See the Inventory list as of 11/30/18 here, or see the MB Dashboard for up-to-the-minute data.
Active listings by region of Manhattan Beach in this report:
- Tree Section: 26 actives (+3)
- Sand Section: 38 actives (-7)
- Hill Section: 5 actives (-1)
- East MB: 21 (-4)
We're also providing a report on closed sales by region of MB.
Sales data, including PPSF for all properties, are organized by sub-region of Manhattan Beach.
Here's a link to the spreadsheet: "MB Pending/Sold as of 11/30/18."
Please see our blog disclaimer.
Listings presented above are supplied via the MLS and are brokered by a variety of agents and firms, not Dave Fratello or Edge Real Estate Agency, unless so stated with the listing. Images and links to properties above lead to a full MLS display of information, including home details, lot size, all photos, and listing broker and agent information and contact information.


