Happy new year to you.
We've closed the books on 2018 and everyone should be ready to make 2019 happen.
This will be our last biweekly market update for 2018, though we'll continue to pore over stats for some time and will share that data with you.
 We gotta start with a headline: Home sales totals in…
Happy new year to you.
We've closed the books on 2018 and everyone should be ready to make 2019 happen.
This will be our last biweekly market update for 2018, though we'll continue to pore over stats for some time and will share that data with you.
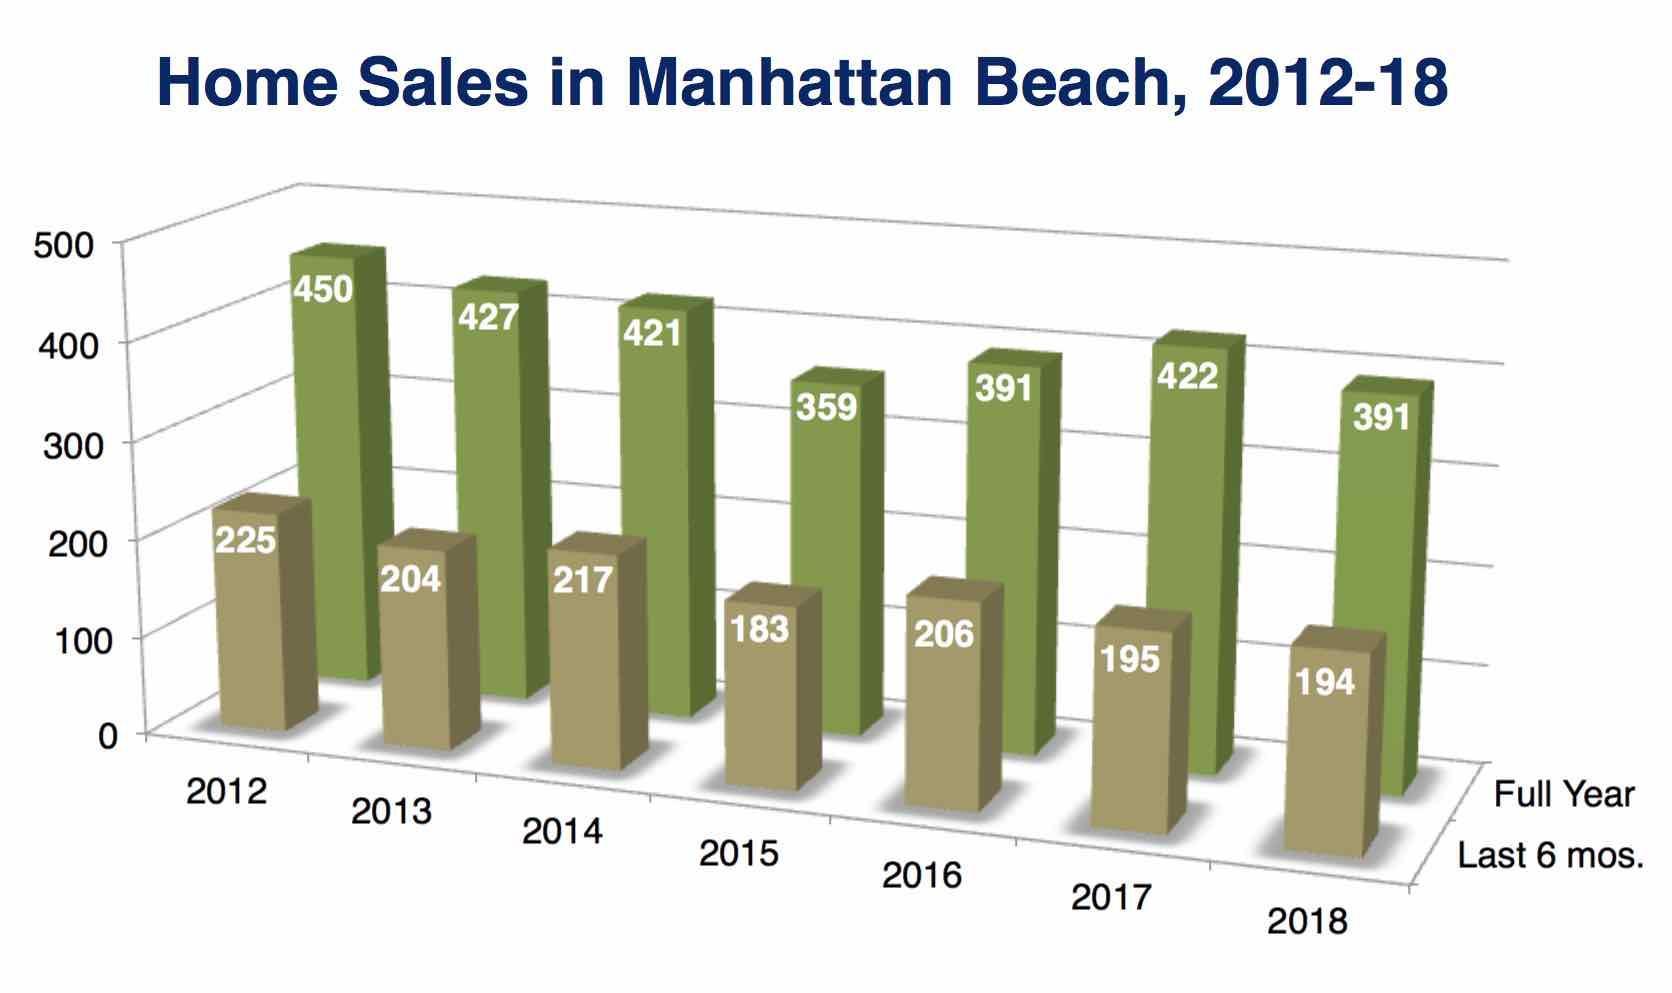
We gotta start with a headline: Home sales totals in Manhattan Beach were down from 2017, but even with 2016.
At 391 total sales, Manhattan Beach saw the exact same number of sales as 2 years prior.
We were down 31 from 2017 (-7%), but up 32 from 2015 (+9%).
Because it did seem that the second half of the year 2018 was a bit slow - particularly the 4th quarter - we compiled sales totals from the last half of each year, also.
From July 1-Dec. 31, with 194 closed sales, you can see that 2018 nearly matched the 195 sales of 2017's final half.
Both years were a bit below 4 of the prior 5 years' second halves.
We'll keep looking at the stats, but closing data, in and of themselves, do not suggest a great worry.
Forward-looking indicators may give us some challenges as the 2019 market takes shape.
Today we'll look only at inventory of homes for sale.
We had a feeling that 2018 was going to end with a lot of unsold inventory, and it did. Our end-of-November report pointed out a new recent high of 90 listings on market just after Thanksgiving, more than 20 higher than 2017, and much higher than at the same point in 2013-14.
We said then, "This would seem to count as evidence of the market slowing down in Q4 2018. Certainly, it's evidence of a change afoot."
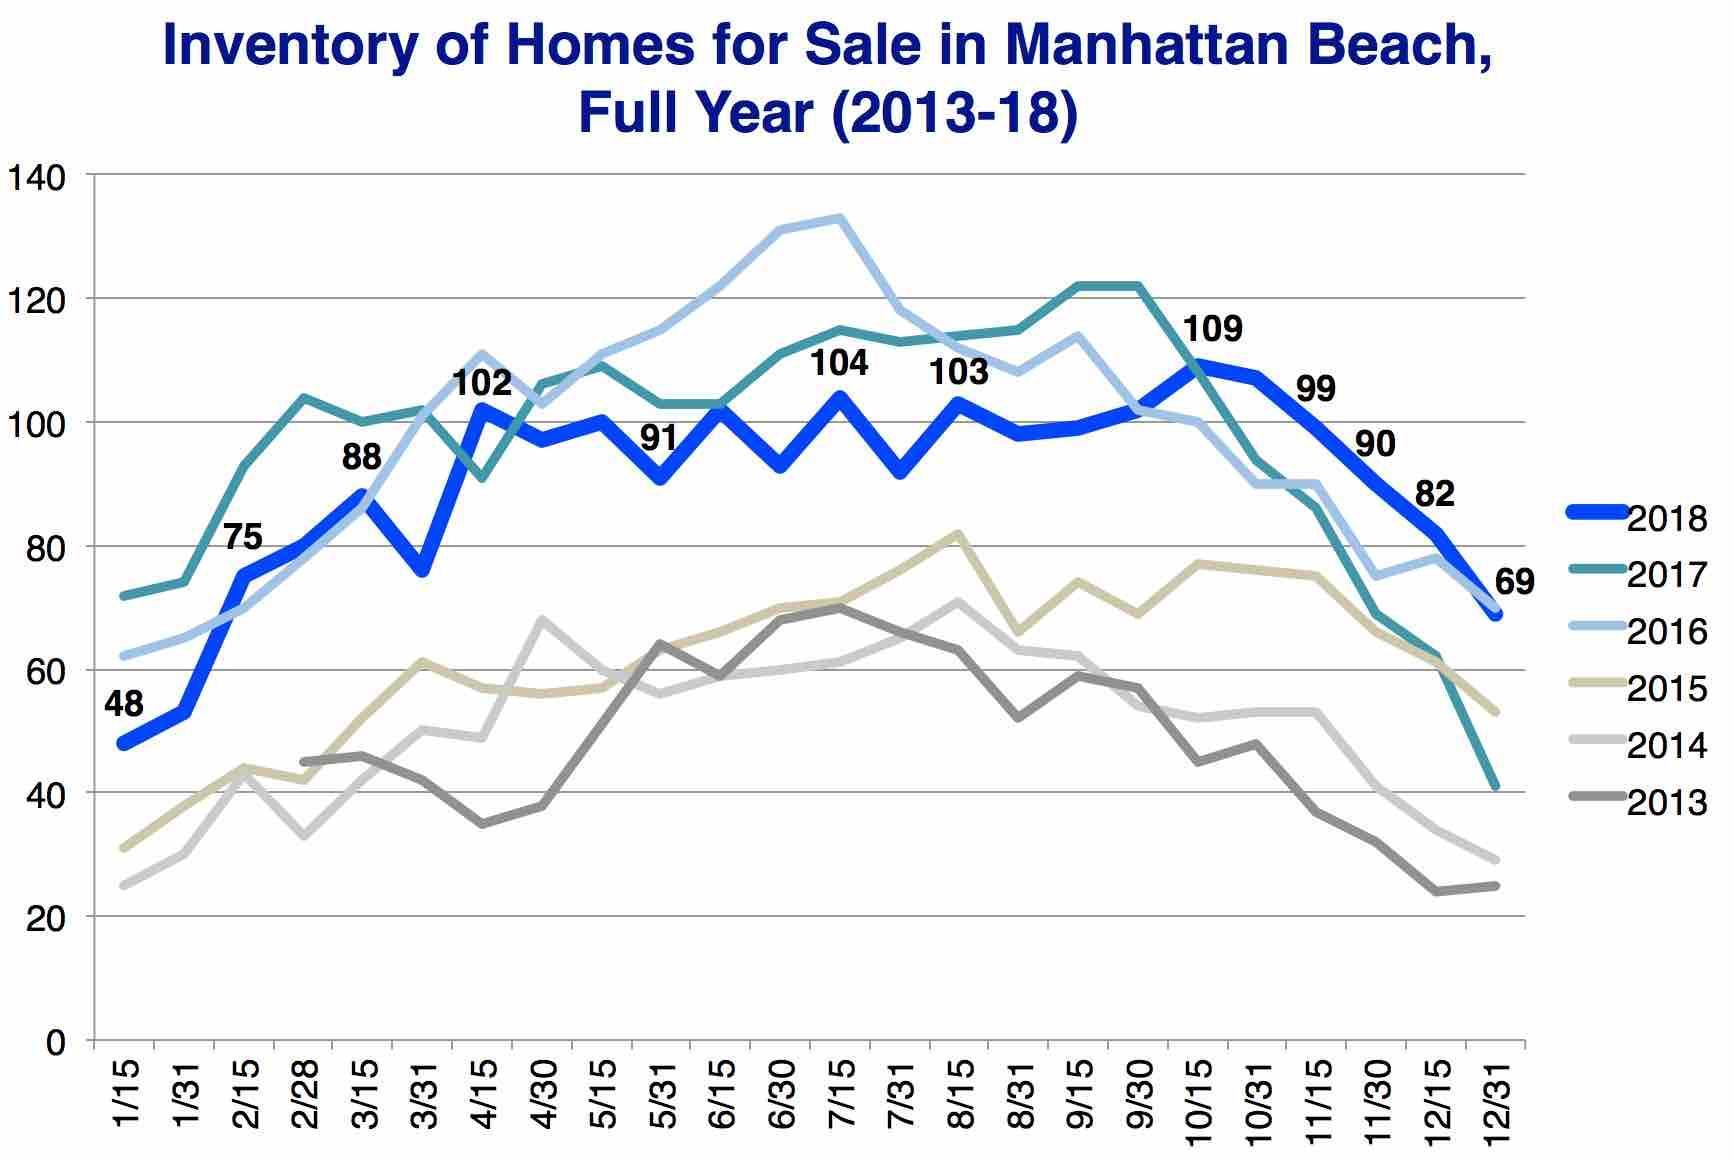 Now we have the data, and it's a bit funny to say, but 2018 didn't end with the most inventory of recent years.
By closing with 69 listings active on the MLS, 2018 actually finished one listing lower than 2016.
Granted, both were the highest-inventory end-of-year figures recorded in the current warm-to-hot market (2013-18).
We find it useful to look at this complete chart to note the overall similarity of inventory figures for 3 years running (2016-18).
There were actually fewer homes for sale throughout 2018 than at most equivalent points in 2016 and 2017. Until the 4th quarter, that is. (Here is some foreshadowing: You are going to hear about the 4th quarter over and over in upcoming posts. It's important.)
On Oct. 15, 2018, inventory branched up and above both 2016 and 2017 levels, hitting 109 listings, and remained above all 5 prior years right through the virtual tie with 2016 at year end.
This is yet more evidence that the last 3 months of 2018 were a time when something was going on. Or, really, less of something was going on (buyers buying).
Brief update: After our post-Christmas story about November/December listings mostly not selling, none of the active listings found a buyer, but one more canceled off the MLS.
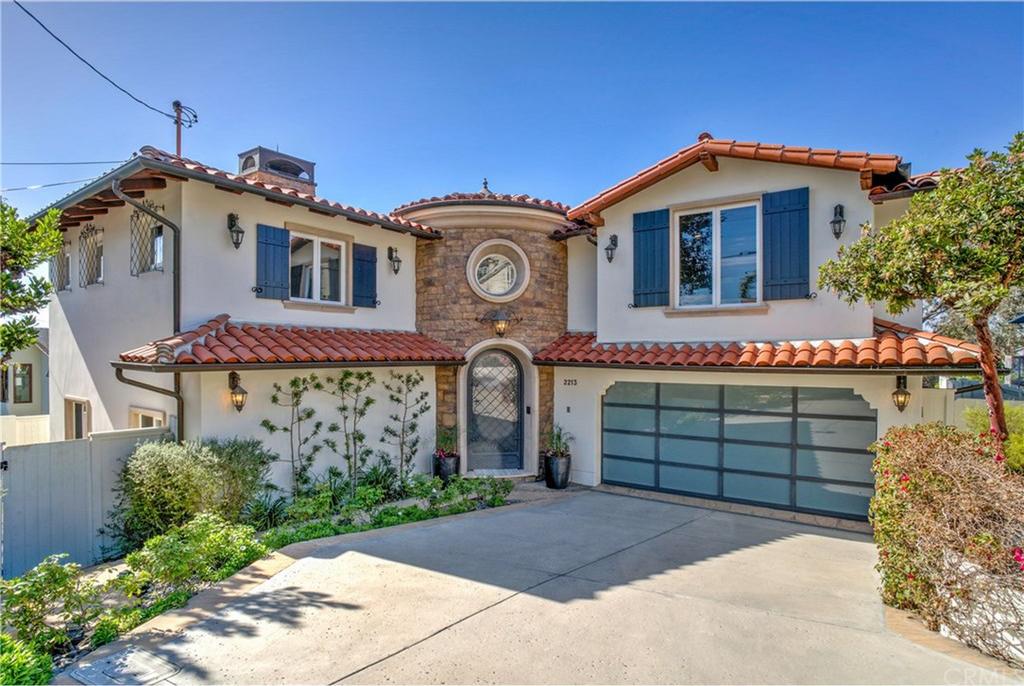 The last home to close in 2018 was a unique corner-lot updated Mediterranean in the Martyrs area at 2213 Agnes (5br/4ba, 4675 sqft.). The home came out in 2016 asking $4.599M, but rented out.
This year, list was $3.995M and closing was at $3.762M.
Also in a Martyrs-adjacent area of the Trees, 1821 Palm (4br/4ba, 4130 sqft.) closed just a bit under asking at $3.200M.
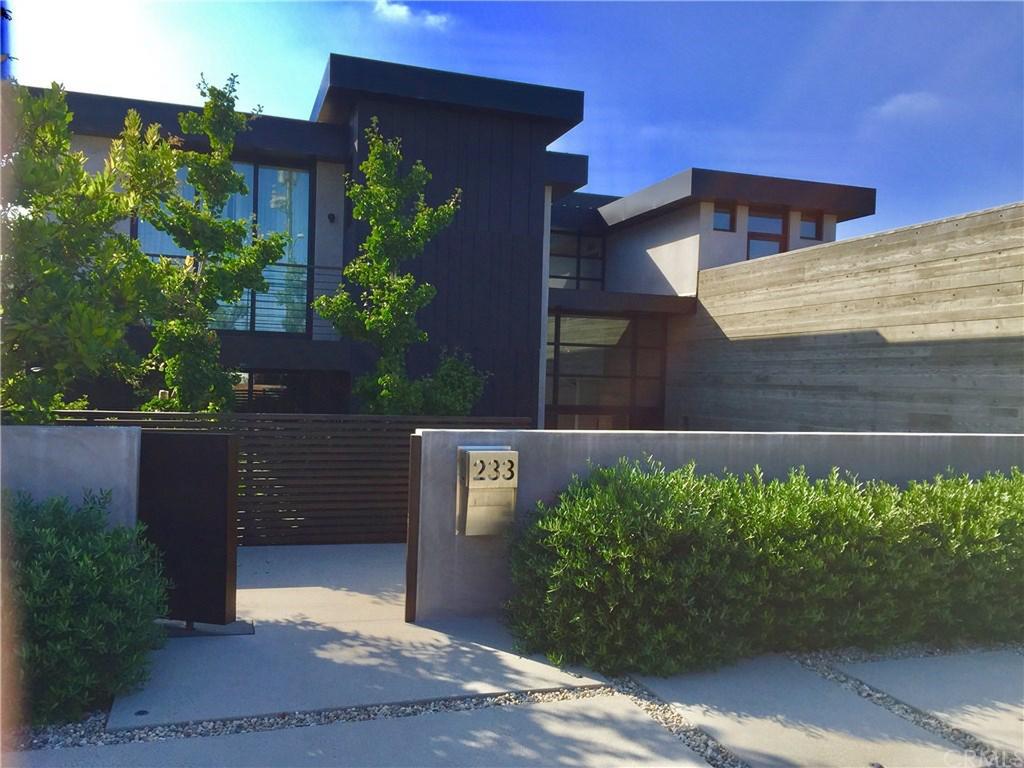 Two of the biggest closings of the period were 233 S. Meadows (4br/6ba, 5580 sqft.), a custom East MB modern on a nearly double-sized lot (~14K sqft.) that sold for $5.600M, and 108 The Strand (you know, the TV modern), which closed for $15.250M, more than $4.7M below its start price oh-so-long ago.
(See "Big Strand Listing Finally Sells" for more on the latter one.)
Here's the rest of our local real estate market update report for the period ending 12/31/18:
- 69 active listings as of 12/31/18 (-13 from 12/15/18)
- 54 SFRs (-10)
- 15 THs (-3)
See the Inventory list as of 12/31/18 here, or see the MB Dashboard for up-to-the-minute data.
Active listings by region of Manhattan Beach in this report:
- Tree Section: 19 actives (-5)
- Sand Section: 28 actives (-5)
- Hill Section: 5 actives (flat)
- East MB: 17 (-3)
We're also providing a report on closed sales by region of MB.
Sales data, including PPSF for all properties, are organized by sub-region of Manhattan Beach.
Here's a link to the spreadsheet: "MB Pending/Sold as of 12/31/18."
Please see our blog disclaimer.
Listings presented above are supplied via the MLS and are brokered by a variety of agents and firms, not Dave Fratello or Edge Real Estate Agency, unless so stated with the listing. Images and links to properties above lead to a full MLS display of information, including home details, lot size, all photos, and listing broker and agent information and contact information.


