Thinking about the Manhattan Beach real estate market, you mostly have to be looking ahead to whatever's coming.
But we'll look back at some stats from January first.
We thought to take a look at how many homes sold here in the first month of the year, in case this might be a first indicator of where things might be going.
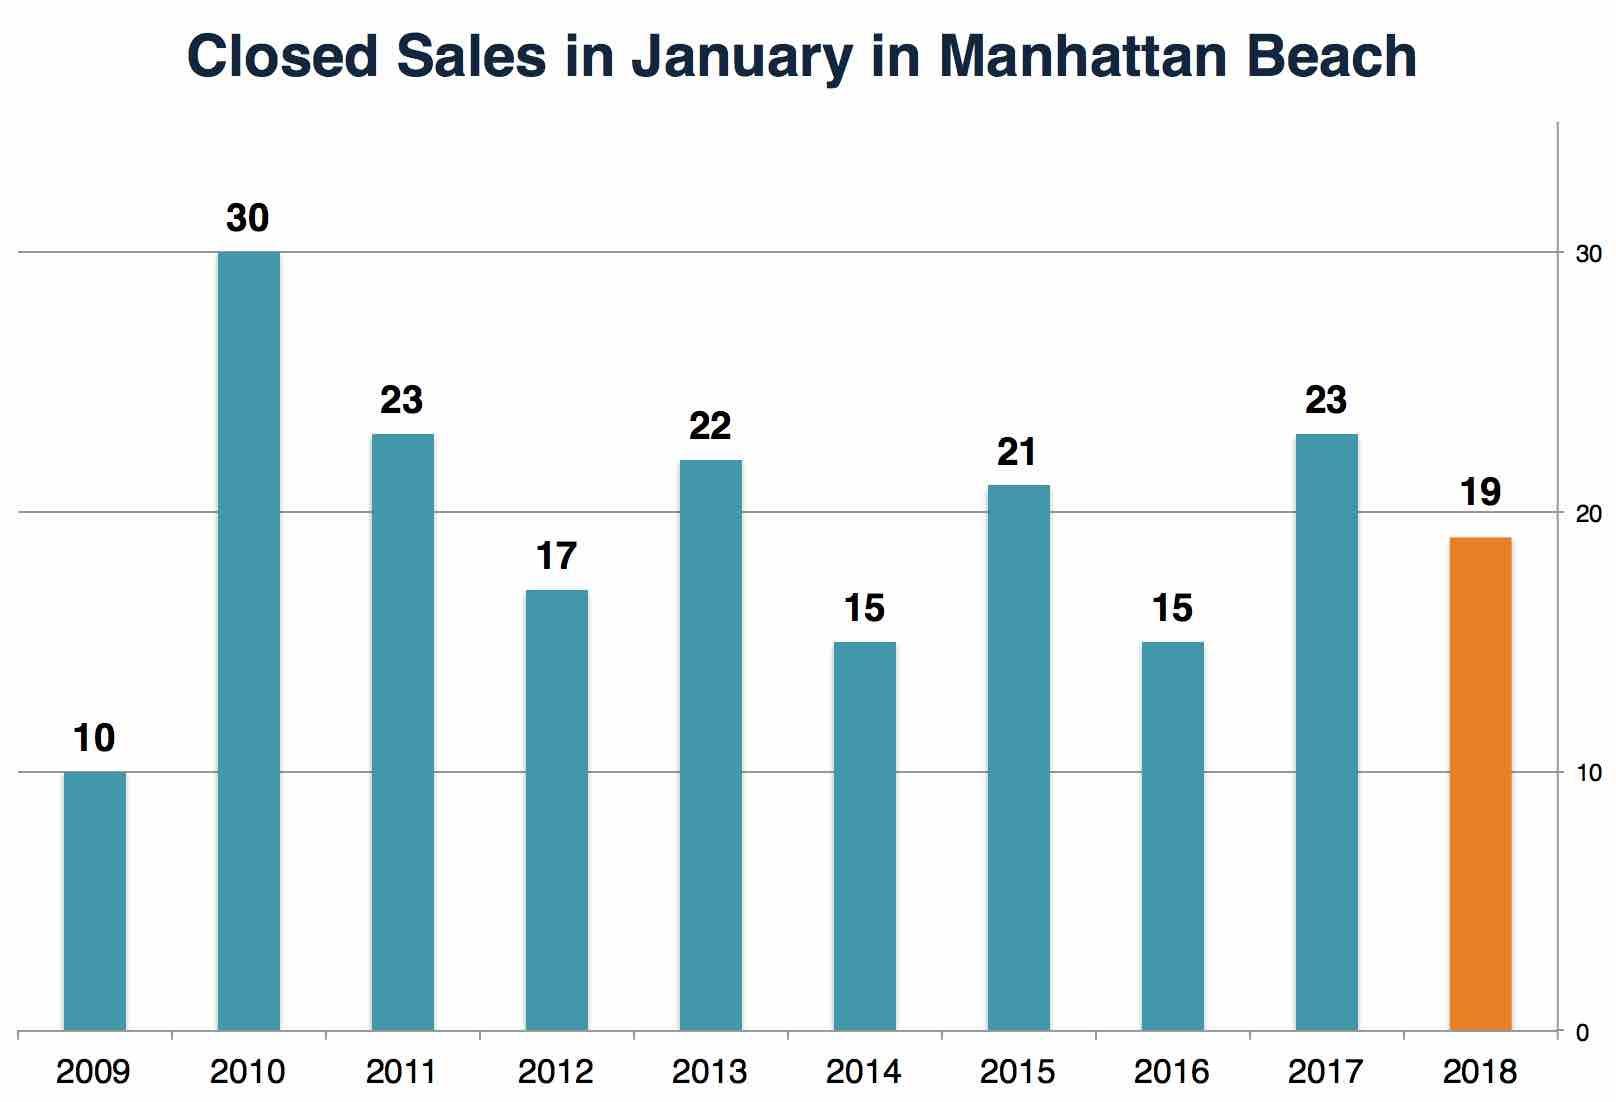
Turns out, this year's January sales looked a lot like 5 of the last 10 years.
At 19 closings, we were down 4 from 2017 but up 4 from 2016.
Of course, January never has a ton of closings, because January sales reflect mostly deals made in November/December the prior year, and that's a quieter time.
Looking at the pattern in the market over 10 years, it mostly seems that January closings aren't predictive of much.
Mainly we're just glad to see that January wasn't awful, after Q4 2018 kinda was. (The median price for the year rose, but the sales total for Q4 was the lowest in a decade.)
One interesting point on our chart is near the start. You can see with that busy, busy January 2010 the first clear sign of recovery in our local market after a bumpy 2007, wobbly/declining 2008 and terrible 2009.
With 30 closings in the first month of 2010, you see some evidence of how the market began to solidify by Q4 2009. That is a turning point we've observed before.
If ever the market turns soft again (c'mon, it always does), we'll eventually be looking for buds on the tree branches just like early 2010 provided.
 We'll also look at inventory, and here's a more concerning sign.
Inventory right before the Super Bowl was the highest in 7 years, beaten on our chart here only by January 2012.
Last year started out low, so it's a big jump, 50% year-over-year, from 53 to 80 listings.
Before we look at more stats for the period, let's focus on a few of the notable sales in the second half of the month.
First is an East Manhattan Beach Mediterranean.
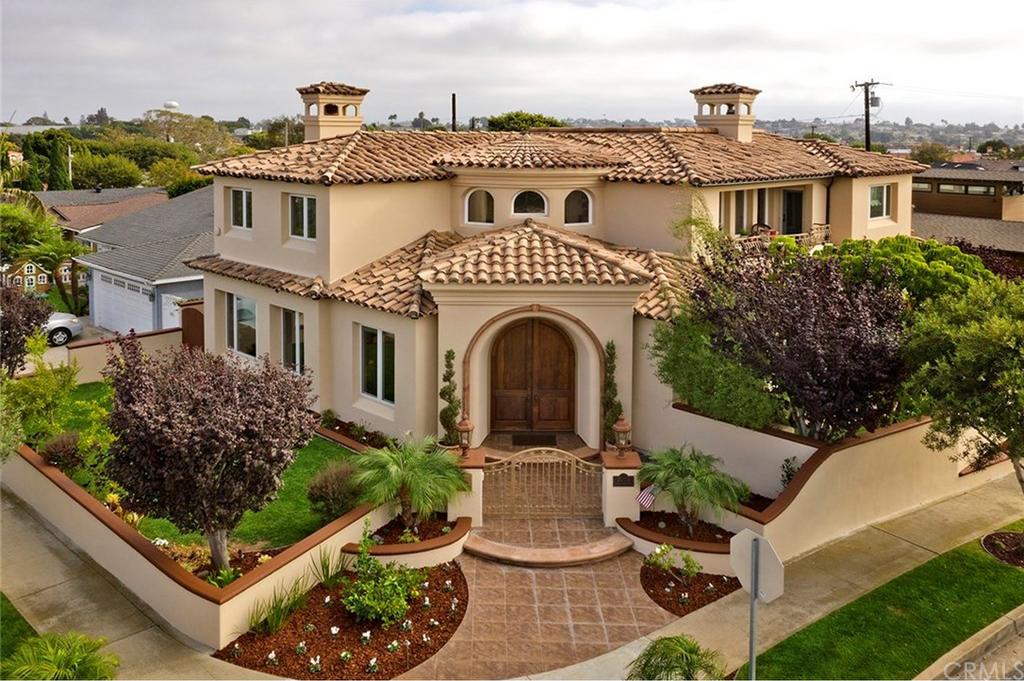 The custom corner-lot home at 2013 Magnolia (4br/4ba, 3575 sqft.) is in a very quiet location, surprisingly close to the schools, Sepulveda and Marine.
It was built in 1997 and with a bit of a different layout suited to the lot. There's no "backyard" exactly, just small front and side yards on this 5675 sqft. lot. Only 3br upstairs.
While the home was clean and showed well, the floorplan and lack of traditional yard must have held it back.
Launched high at $2.550M in September, it got into its third month before making a deal.
A sale at $2.225M put it lower than you might have expected, not to mention 13% under asking. The offer came in just days before Christmas.
Comps among homes on similar lots would have been 1335 11th (5br/6ba, 3450 sqft., $2.450M in July 2018) and 1617 23rd (5br/5ba, 3635 sqft., $2.450M in June 2018). Earlier in January, there was also a sale at 2104 Manzanita (5br/4ba, 3550 sqft.) at $2.390M.
So you could say 2013 Magnolia "should" have sold in the 2.3-2.4 range, right?
Now they may have helped reset the comps.
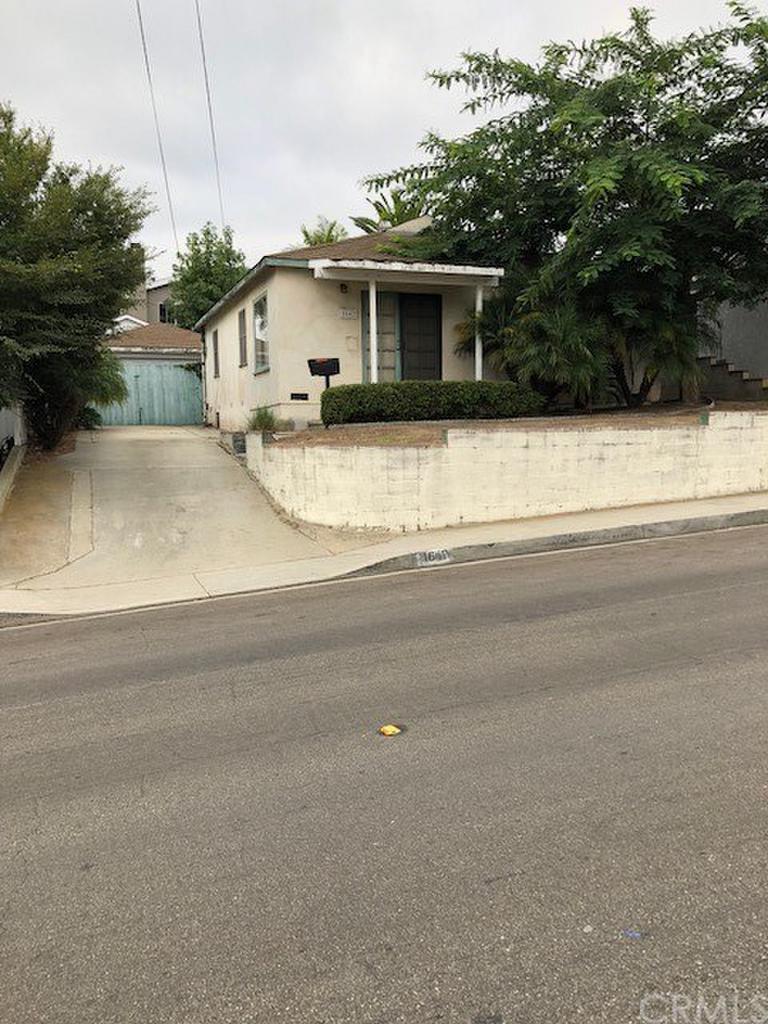 There was also a matched set of similarly original, small East MB cottages, both fixers to a degree with a lot of land value in the sales. Both are on plots of about 5100 sqft.
Those sales were 1642 2nd ($1.155M) (pictured) and 1351 Curtis ($1.378M).
It's a short walk from one house to the other, though 2nd St. obviously is the busier location.
But 2nd also sold for 16% less. (Dave's clients got it and have plans for the property.)
Only two (fixer) SFRs on comparable lots sold in all of 2018 with a $1.1 in front of the price.
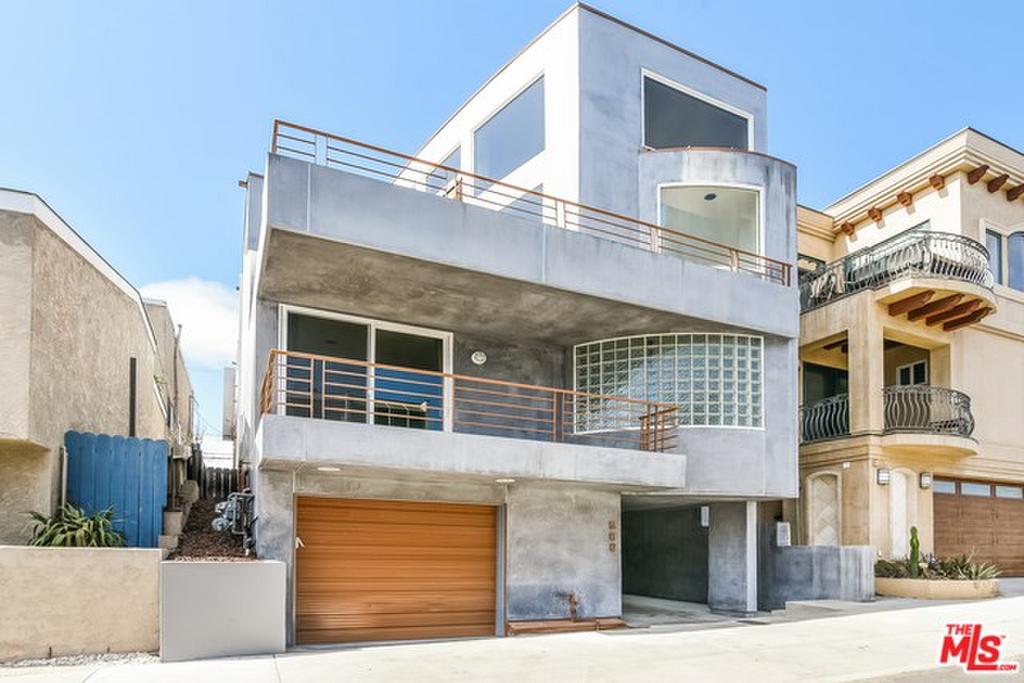 Maybe the main notable Sand Section sale this period was a front-unit townhome at 417 21st St. (3br/4ba, 2085 sqft.).
The 1990 original does have some views but will be a project.
It began at $2.450M, lingered 5 months and sold eventually for $2.200M.
We're reminded that we had informally discussed a value for that property with a client early in the listing. It seemed $2.200M was the low and something in the $2.3s seemed likely at the time.
Time on market brought that value to the lowest end.
Remember this? When you start too high, you take less.
 A Tree Section lot at 2800 Ardmore rounds out our review here.
The big 6000 sqft. corner sports a charming original cottage now (3br/2ba, 1275 sqft.), but that's not going to be a permanent feature.
A local builder picked it up and will eventually deliver the market a big new house, much like the one currently being finished directly across 28th St.
How will that upcoming new home perform on the market? Stay tuned.
Here's the rest of our local real estate market update report for the period ending 1/31/19:
- 80 active listings as of 1/31/19 (-4 from 1/15/19)
- 60 SFRs (-6)
- 20 THs (+2)
See the Inventory list as of 1/31/19 here, or see the MB Dashboard for up-to-the-minute data.
Active listings by region of Manhattan Beach in this report:
- Tree Section: 22 actives (flat)
- Sand Section: 32 actives (-1)
- Hill Section: 5 actives (-1)
- East MB: 22 (-2)
We're also providing a report on closed sales by region of MB.
Sales data, including PPSF for all properties, are organized by sub-region of Manhattan Beach.
Here's a link to the spreadsheet: "MB Pending/Sold as of 1/31/19."
Please see our blog disclaimer.
Listings presented above are supplied via the MLS and are brokered by a variety of agents and firms, not Dave Fratello or Edge Real Estate Agency, unless so stated with the listing. Images and links to properties above lead to a full MLS display of information, including home details, lot size, all photos, and listing broker and agent information and contact information.


