Seems like we're always trying to help answer one question: How's the market?
The surprising news so far for 2019 is: Things are almost as good this year in Manhattan Beach real estate as in that go-go "sugar high" year of 2017.
Improbable as it may seem, that's the truth.
We'll be going into much greater…
Seems like we're always trying to help answer one question: How's the market?
The surprising news so far for 2019 is: Things are almost as good this year in Manhattan Beach real estate as in that go-go "sugar high" year of 2017.
Improbable as it may seem, that's the truth.
We'll be going into much greater depth in an upcoming, comprehensive report on the local market.
But let's share a good preview here.
Total number of sales Jan. 1-May 31, 2017: 168
Total number of sales Jan. 1-May 31, 2019: 166
Both 2017 and 2019 are at least 20 sales higher than the other years within 2015-2019 in the number of sales for this 5-month period.
We have heard the chatter about how it's the "high end" that's wobbly this year.
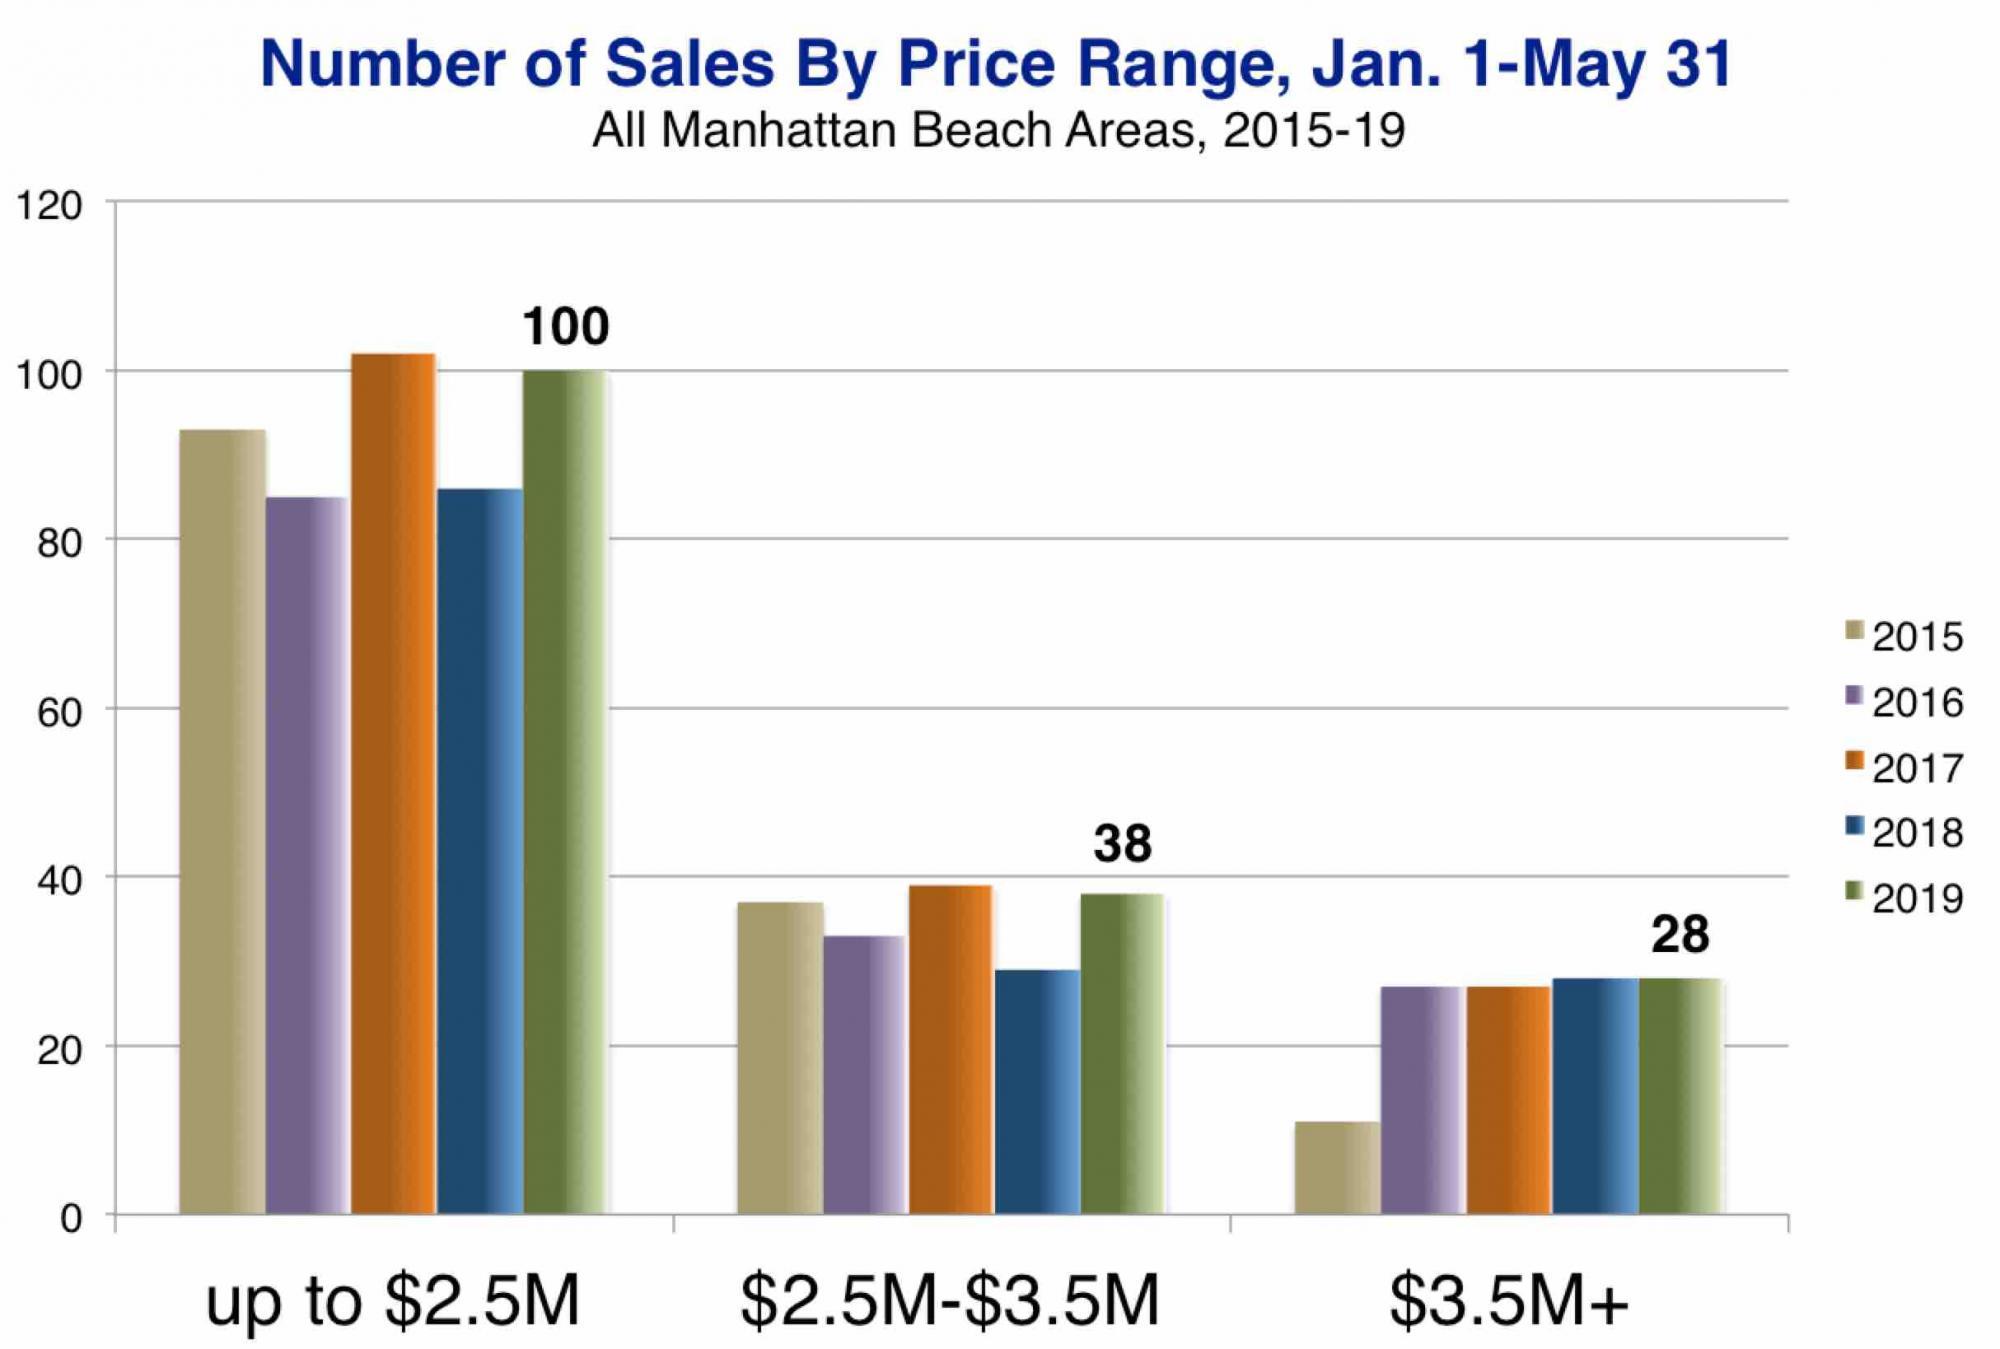
Instead, we show 2019 looking pretty normal for all segments of the Manhattan Beach market.
Just look at sales by price range for the past 5 years.
You will quickly see a few things once you follow what our chart is showing:
• Sales totals are up, year-over-year, in all price ranges.
• Sales totals are closest to 2017, that "sugar high" year.
• The number of higher-end sales ($3.5M+) has been pretty consistent for 4 straight years.
Basically, demand is working out just fine this year.
It's inventory where you may find some worries. We've been running a bit high all year, relative to recent years.
With 129 listings as of May 31, we were up 42% over the 91 listings May 31, 2018.
And we still have about half of all listings priced over $3.5M.
That's an odd look when you see that only 28 out of 166 sales (17%) in the first 5 months this year were priced over $3.5M. (We looked indepth just 2 weeks ago at the question: "Is MB Inventory Often 'Top-Heavy?'")
If demand is around the same and inventory swells, the expectation would be some softness in pricing. But where? We'll investigate.
 We created one more chart that the seriously nerdy among you may enjoy.
The featured chart up above looks at just 3 price ranges. Here we broke out 5 price ranges for a very similar chart that takes a little more work to follow.
What you might note here that wasn't evident in the 3-category chart:
• The biggest boost in sales was in the under-$1.5M category.
• Sales $3.5M-$5.0M were down year-over-year, but $5M+ sales were up YOY.
Ordinarily in our twice-monthly market updates, we like to focus on a few recent sales.
 This time we're just looking to one, a Hill Section project at 933 8th.
It's a 70s/80s house build into a downsloping hillside with interesting views to the north.
We frankly found the notion of updating it daunting, as evidenced by comments in our open-house review.
We said 933 8th "has the capacity to dazzle you with the possibilities and the challenges."
And we added, "To truly modernize the home would take a commitment and effort that's a little tough to entertain, but if you can imagine the end product with modern touches, it might be really something. The issue is that just about every aspect of the house has to be touched, and the bills will start to really ring up."
The proportion of buyers willing to take on a serious remodel is usually a small percentage of the buyer pool. But at 933 8th, the listing got full price ($3.275M) after less than 2 weeks on market.
Now join us in cheering the remodel.
Here's the rest of our local real estate market update report for the period ending 5/31/19:
- 129 active listings as of 5/31/19 (+6 from 5/15/19)
- 103 SFRs (+4)
- 26 THs (+2)
See the Inventory list as of 5/31/19 here, or see the MB Dashboard for up-to-the-minute data.
Active listings by region of Manhattan Beach in this report:
- Tree Section: 26 actives (-2)
- Sand Section: 62 actives (+9)
- Hill Section:16 actives (flat)
- East MB: 25 (-1)
We're also providing a report on closed sales by region of MB.
Sales data, including PPSF for all properties, are organized by sub-region of Manhattan Beach.
Here's a link to the spreadsheet: "MB Pending/Sold as of 5/31/19."
Please see our blog disclaimer.
Listings presented above are supplied via the MLS and are brokered by a variety of agents and firms, not Dave Fratello or Edge Real Estate Agency, unless so stated with the listing. Images and links to properties above lead to a full MLS display of information, including home details, lot size, all photos, and listing broker and agent information and contact information.


