Month's end came right before the long weekend, so we didn't have the chance to post our most recent MB Market Update. And be honest: Would you have read it, or gone to the beach?
 Now we've got the basic data and links for you here. We'll do a more thorough look next week at the first half of 2017.
How's the…
Month's end came right before the long weekend, so we didn't have the chance to post our most recent MB Market Update. And be honest: Would you have read it, or gone to the beach?
Now we've got the basic data and links for you here. We'll do a more thorough look next week at the first half of 2017.
How's the sales pace?
What's inventory like compared to recent years?
How are prices?
We'll get all nerdy looking back at questions like those for the first half, in posts starting next week.
 Just looking at the second half of June, though, one thing fairly jumps off the page: There were 17 closings in the Tree Section just in this 2-week period.
That's out of 30 total closings in the last half of June. More than half in the Trees! (See our solds report here.) More than 20% of the sales for the year in the Trees just closed within 2 weeks.
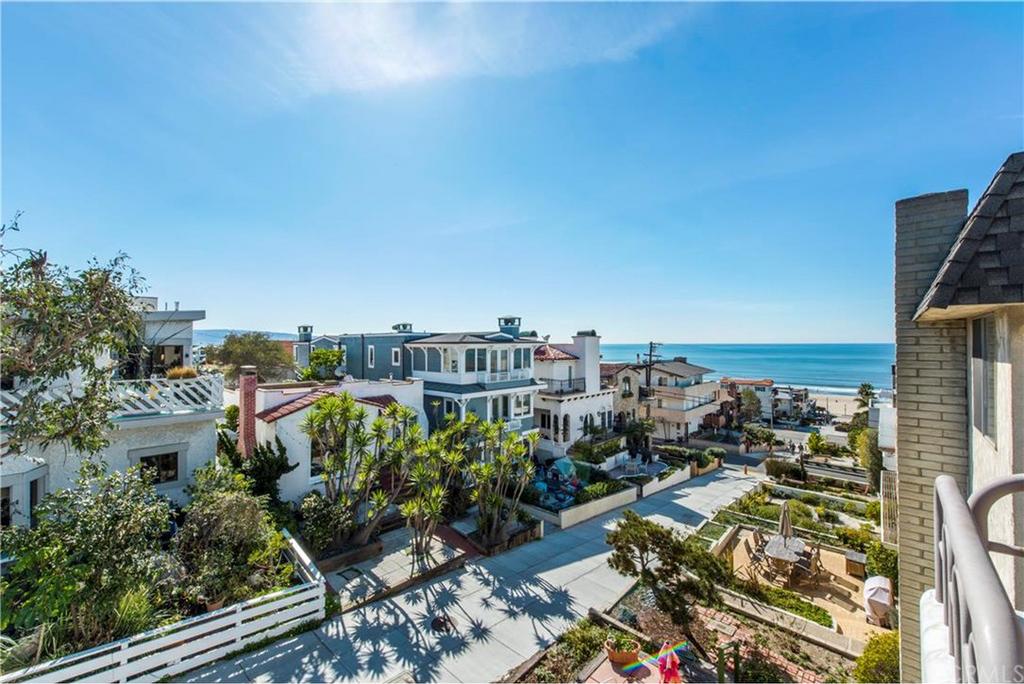
Meantime, there was just one closing in the Hill Section (1106 John), three in the Sand Section (including Dave's listing at 233 7th, pictured above) and 9 in all of East Manhattan.
So we took a peek at first-half 2017 stats, and found that the Tree Section has been busiest all year.
One-third of all sales in Manhattan Beach this year (227) have been in the Trees (76).
Now, that's consistent with the distribution of sales among areas of Manhattan Beach last year, for the first half, but for this particular 2-week period to see more than half of sales occurring in the Trees really stands out.
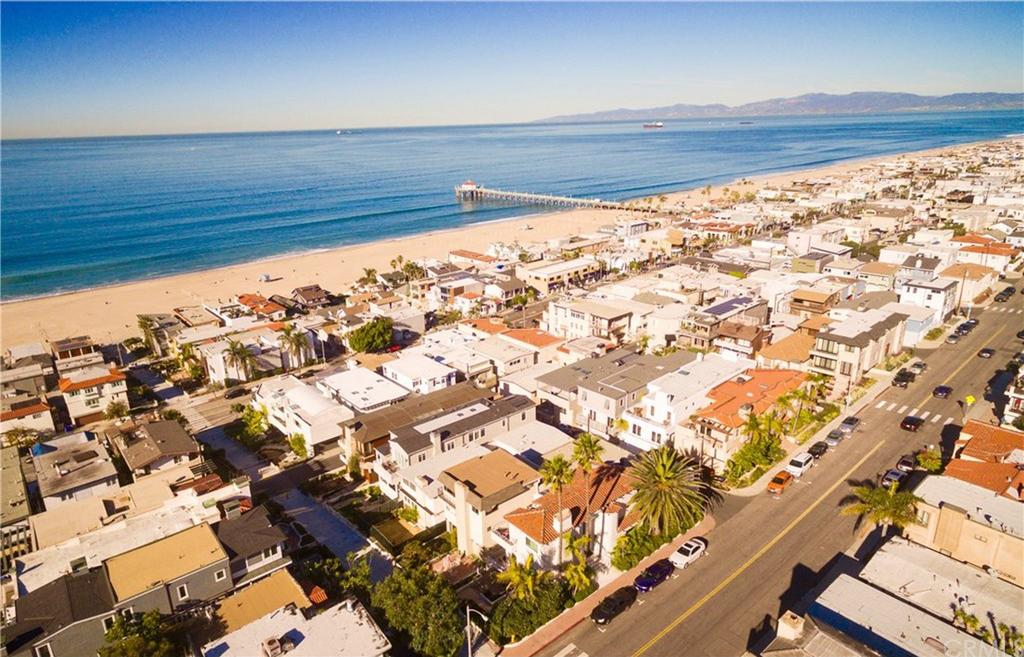 Don't cry too much for the Sand Section, by the way.
While inventory by the beach has lingered a lot higher this year, the sales pace for the first half of the year is still better than 2016 (50 sales so far compared with 40 in the first half of 2016).
Inventory city-wide was up by 8 by the end of June, part of a trend we should expect, with sales generally slower during the Summer months.
Here's the rest of our local real estate market update report for the period ending 6/30/17:
- 111 active listings as of 6/30/17 (+8)
- 96 SFRs (+12)
- 15 THs (-4)
See the inventory list as of 6/30/17 here, or see the MB Dashboard for up-to-the-minute data.
Active listings by region of Manhattan Beach in this report:
- Tree Section: 20 actives (+1)
- Sand Section: 52 actives (-2)
- Hill Section: 12 actives (+2)
- East MB: 27 actives (+7)
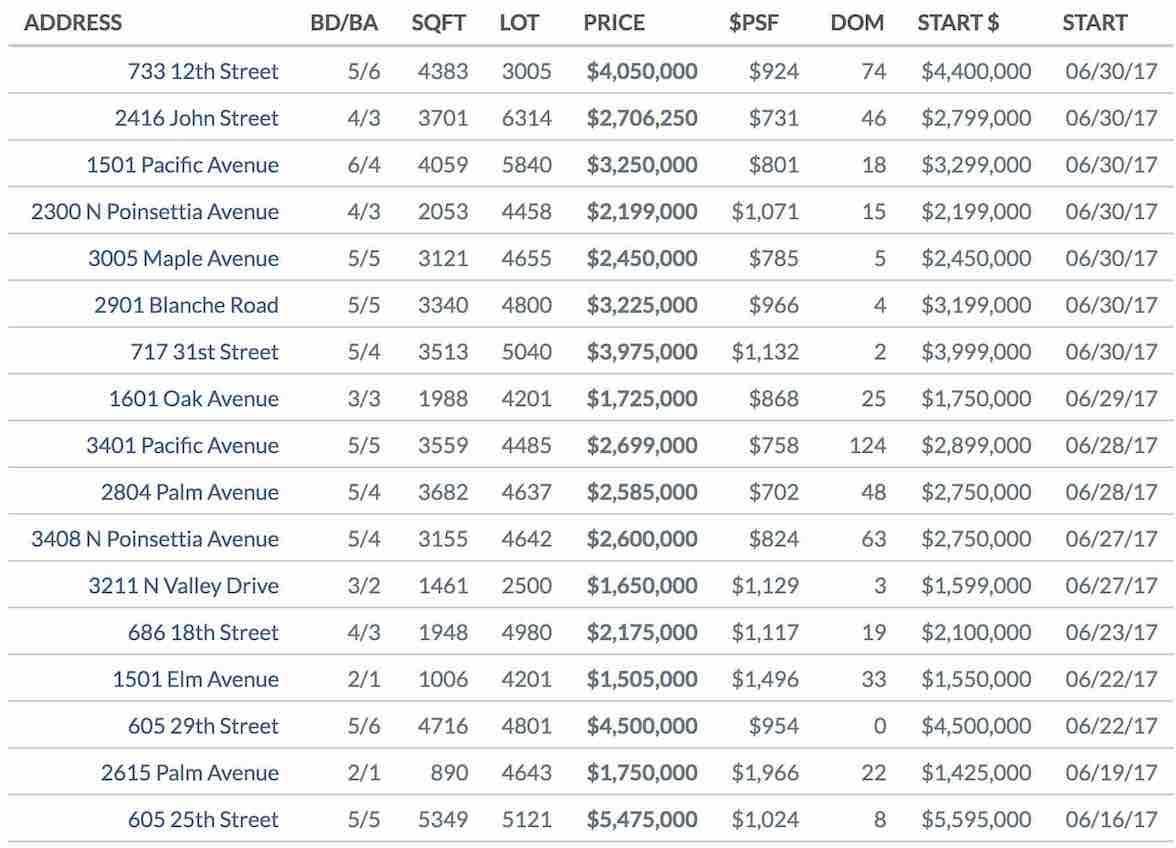
We're also providing a report on closed sales by region of MB.
Sales data, including PPSF for all properties, are organized by sub-region of Manhattan Beach.
Here's a link to the spreadsheet: "MB Pending/Sold as of 6/30/17."
Please see our blog disclaimer.
Listings presented above are supplied via the MLS and are brokered by a variety of agents and firms, not Dave Fratello or Edge Real Estate Agency, unless so stated with the listing. Images and links to properties above lead to a full MLS display of information, including home details, lot size, all photos, and listing broker and agent information and contact information.
Based on information from California Regional Multiple Listing Service, Inc. as of April 27th, 2024 at 6:25am PDT. This information is for your personal, non-commercial use and may not be used for any purpose other than to identify prospective properties you may be interested in purchasing. Display of MLS data is usually deemed reliable but is NOT guaranteed accurate by the MLS. Buyers are responsible for verifying the accuracy of all information and should investigate the data themselves or retain appropriate professionals. Information from sources other than the Listing Agent may have been included in the MLS data. Unless otherwise specified in writing, Broker/Agent has not and will not verify any information obtained from other sources. The Broker/Agent providing the information contained herein may or may not have been the Listing and/or Selling Agent.


