Things were shaping up for the 2019 Manhattan Beach real estate market to nearly match pace with the boom-boom year of 2017.
At the end of May, we wrote in our regular market update: "Surprise! This year is off to a superb start." And we pointed out that 2017 and 2019 stood tall above other recent years, more…
Things were shaping up for the 2019 Manhattan Beach real estate market to nearly match pace with the boom-boom year of 2017.
At the end of May, we wrote in our regular market update: "Surprise! This year is off to a superb start." And we pointed out that 2017 and 2019 stood tall above other recent years, more than 20 sales higher for January-May.
 Then June happened.
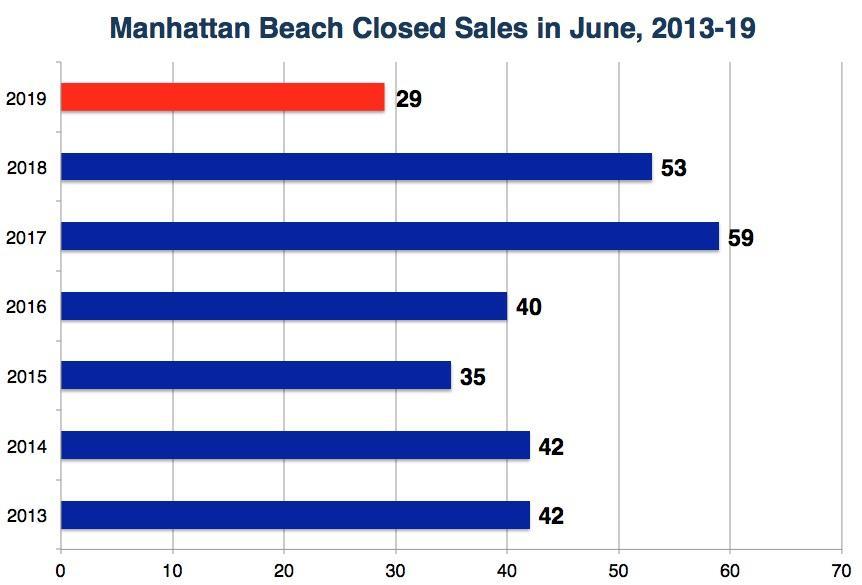
June 2019 was not a go-go month, for whatever reason.
The 29 closings in June 2019 provided the lowest total of the past 7 years.
Remember that whole idea that we were tracking 2017's blistering pace?
June 2019 saw just half the sales of June 2017.
It was a 45% drop in closings year-over-year, comparing just with 2018.
 And with that sluggish June, now 2019 is starting to look pretty normal.
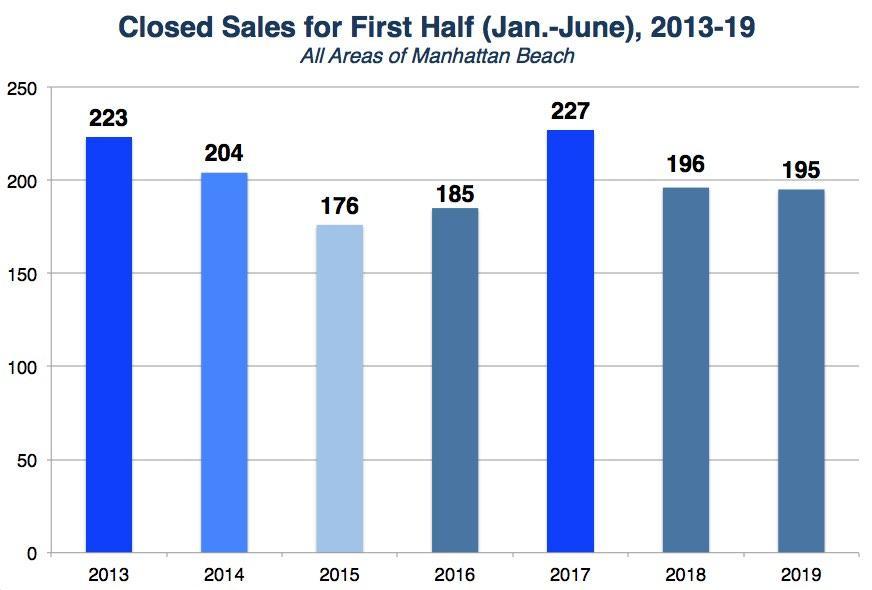
Here are the sales totals for Manhattan Beach homes in the first half of the past 7 years.
Now, with 195 first-half sales, 2019 ranks 5th-best out of 7 years.
It's fine. It's just reason to look again at everything that's going on in the market.
We're still seeing plenty of big sales, and there are tiers in the market where nothing lasts.
We'll have more to say on first-half market data soon.
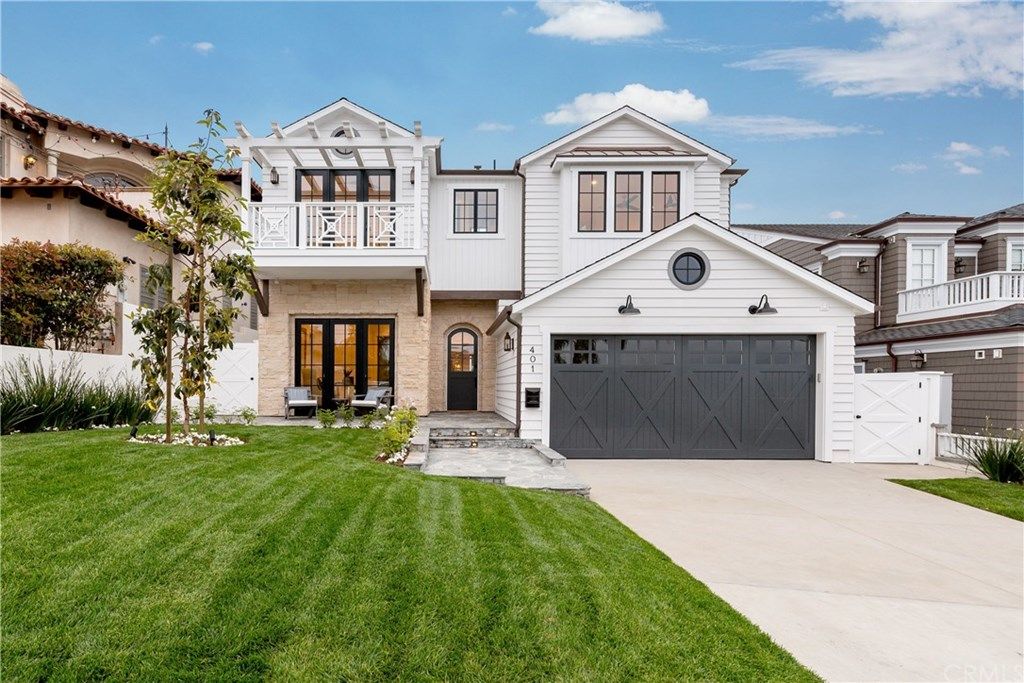 For this period, we'll focus on just one of the big sales, 401 N. Dianthus (6br/7ba, 6300 sqft.), a new construction home in the Hill Section that got $6.772M.
They needed only 2 weeks to make that deal. And this is on the non-ocean-view side of the hill.
Scan through other closed sales from this period in this sheet: "MB Pending/Sold as of 6/30/19."
Here's the rest of our local real estate market update report for the period ending 6/30/19:
- 132 active listings as of 6/30/19 (-4 from 6/15/19)
- 106 SFRs (-2)
- 26 THs (-2)
See the Inventory list as of 6/30/19 here, or see the MB Dashboard for up-to-the-minute data.
Active listings by region of Manhattan Beach in this report:
- Tree Section: 28 actives (-1)
- Sand Section: 64 actives (-3)
- Hill Section:19 actives (flat)
- East MB: 21 (flat)
We're also providing a report on closed sales by region of MB.
Sales data, including PPSF for all properties, are organized by sub-region of Manhattan Beach.
Here's a link to the spreadsheet: "MB Pending/Sold as of 6/30/19."
Please see our blog disclaimer.
Listings presented above are supplied via the MLS and are brokered by a variety of agents and firms, not Dave Fratello or Edge Real Estate Agency, unless so stated with the listing. Images and links to properties above lead to a full MLS display of information, including home details, lot size, all photos, and listing broker and agent information and contact information.
Based on information from California Regional Multiple Listing Service, Inc. as of May 4th, 2024 at 5:16am PDT. This information is for your personal, non-commercial use and may not be used for any purpose other than to identify prospective properties you may be interested in purchasing. Display of MLS data is usually deemed reliable but is NOT guaranteed accurate by the MLS. Buyers are responsible for verifying the accuracy of all information and should investigate the data themselves or retain appropriate professionals. Information from sources other than the Listing Agent may have been included in the MLS data. Unless otherwise specified in writing, Broker/Agent has not and will not verify any information obtained from other sources. The Broker/Agent providing the information contained herein may or may not have been the Listing and/or Selling Agent.


