As we head into the Fall market, Manhattan Beach real estate finds itself in much the same place it was in back in September 2016.
By one measure, we're in precisely the same place.
That measure is "months of supply," which can be simply explained as a formula by which inventory is weighed against the pace…
As we head into the Fall market, Manhattan Beach real estate finds itself in much the same place it was in back in September 2016.
By one measure, we're in precisely the same place.
That measure is "months of supply," which can be simply explained as a formula by which inventory is weighed against the pace of new sales.
How many months would it take, hypothetically, to sell all the inventory that's out there on the market? That's the "months of supply." (See, we didn't even need to reference multivariate regression or anything.)
As our chart shows, at the end of August 2019, the 6-month rolling average for months of supply was at 4.2 months, same as August 2016.
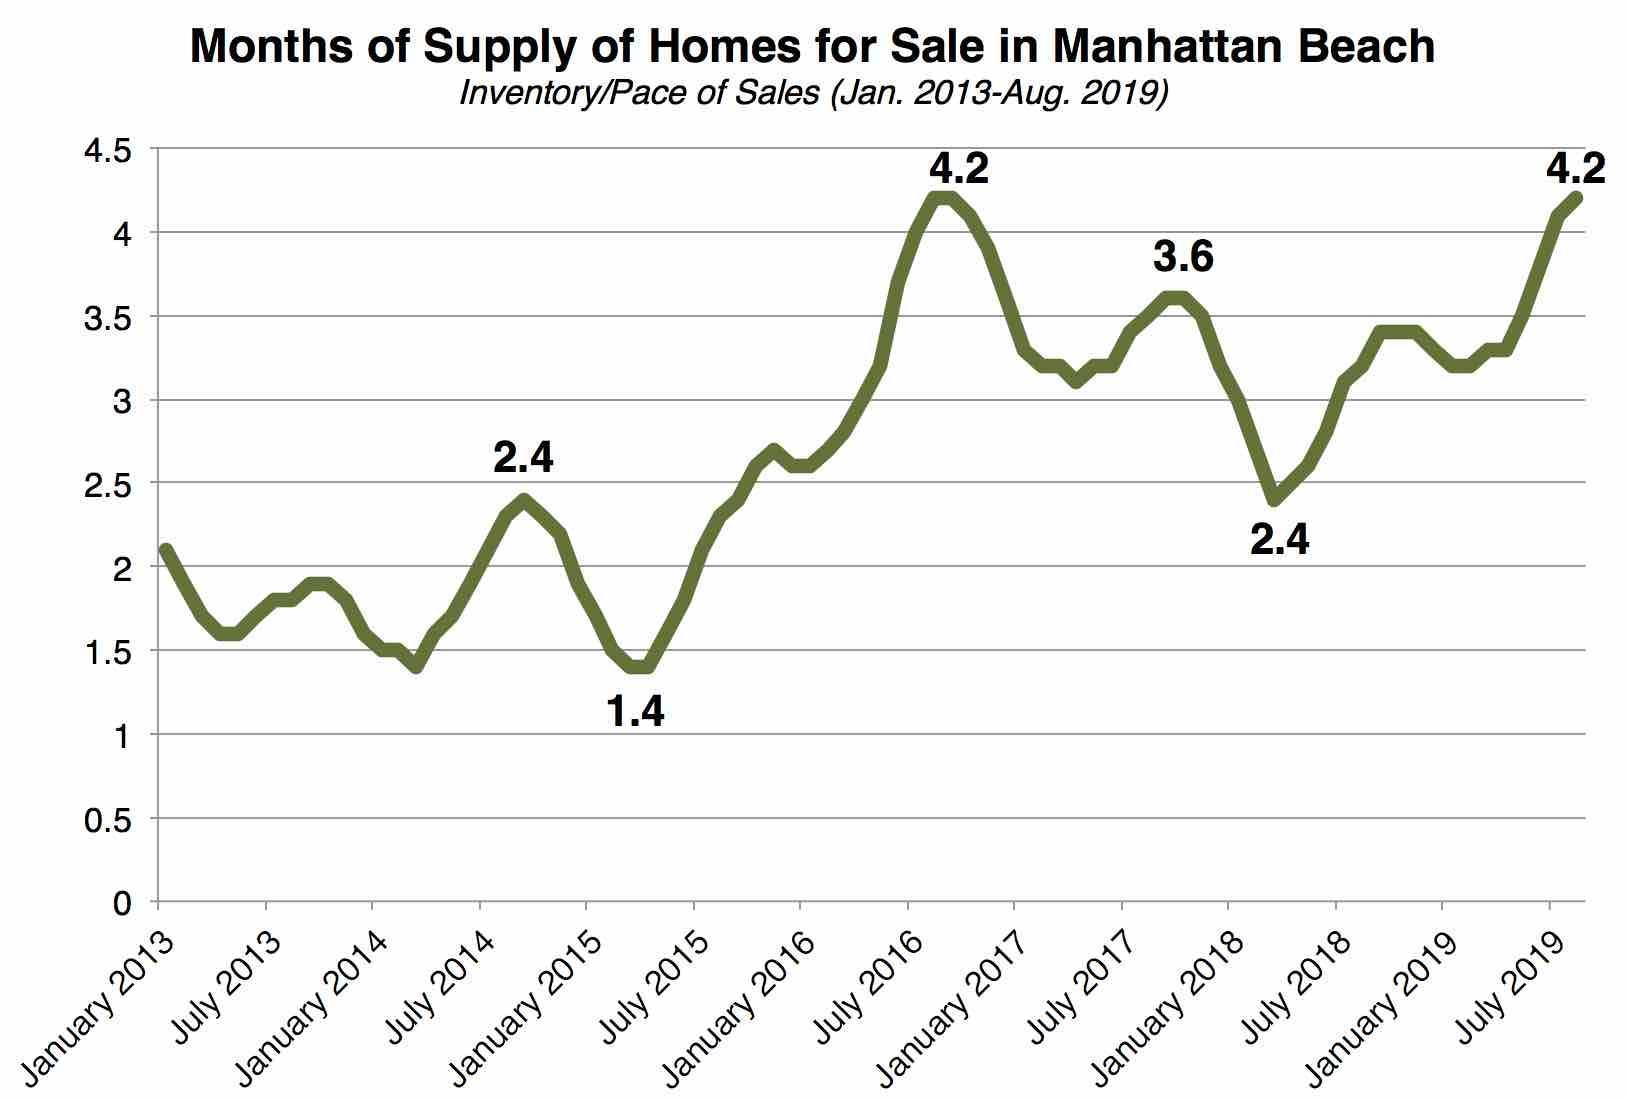
Now, for August alone, it was 4.7 months, but we prefer to focus on bigger trends and not allow noisy, individual monthly data to take the spotlight.
Comparing 2019 to 2016, you see a similar rise from late Spring through Summer, with the 4.2 month figure holding for both August and September that year.
What's notable about 2016, by contrast to 2019, is that 2016 began with a lower months-of-supply figure and rose more steeply.
Months of supply typically drops as the Fall months move along, both because there is more sales activity in September/October, and because sellers tend to quit the market in the later parts of the year. Lower inventory is a key factor reducing the months of supply calculation.
So 2019 hasn't set a record for recent years (yet!), just tied it. And the usual expectation would be that we'll watch this figure drop over the next few months.
That is the "usual expectation."
We would note that this chart features only data back to 2013, roughly coinciding with the current upward market cycle. Between 2008-2011, months of supply was often higher, sometimes scarily higher.
As to how one might read the 4.2 months figure: The received wisdom has always been that 6 months of supply equals a buyers' market. Reality in Manhattan Beach is that 6 months+ is only evident in the most extreme negative markets. And there's a new theory that because the internet speeds the sales cycle for buyers, just 4 months of supply equals a buyers' market. Discuss.
Now, here in 2019, it's up to buyers and sellers to keep the market moving.
Big picture: the market is moving, especially at the (ahem) lower price points. (We mean under $4M.) Mortgage rates have taken another steep dip, which would seem to help.
But sellers need to know not to overplay their hands. Buyers may not be walking around with charts in their hands, but they typically have a good sense of how the winds are blowing. They're being careful in general, but flocking to good buys.
Please see our blog disclaimer.
Listings presented above are supplied via the MLS and are brokered by a variety of agents and firms, not Dave Fratello or Edge Real Estate Agency, unless so stated with the listing. Images and links to properties above lead to a full MLS display of information, including home details, lot size, all photos, and listing broker and agent information and contact information.


