You'll recall that we recently ran a year-end wrapup describing 2011 sales stats for MB.
 In that post, the main findings were:
- Sales of SFRs in MB were almost flat (+12) compared to 2010
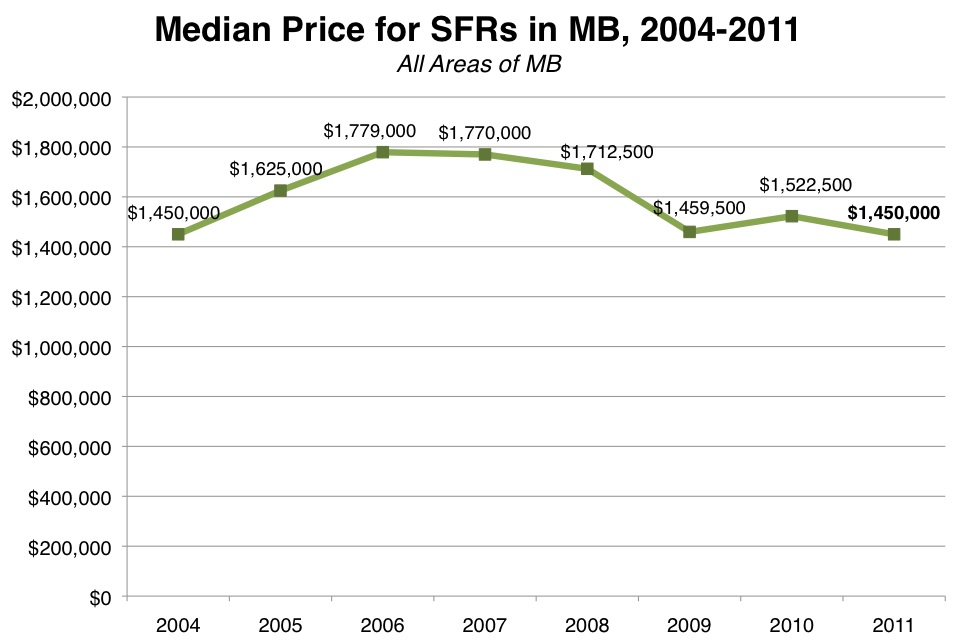
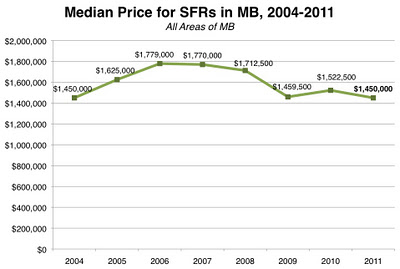
- The median price for SFRs in MB was down 6% from 2010 (we repeat the chart here)
- MB's median price for 2011 was the…
You'll recall that we recently ran a year-end wrapup describing 2011 sales stats for MB.
In that post, the main findings were:
- Sales of SFRs in MB were almost flat (+12) compared to 2010
- The median price for SFRs in MB was down 6% from 2010 (we repeat the chart here)
- MB's median price for 2011 was the same as 2004's (before adjusting for inflation)
Well, recently someone threw some MB RE stats into our front driveway, packaged in a very snazzy, glossy free real estate publication that you also probably get twice a month. (We kinda like the mag.)
This was the first issue of the new year, so we figured we might see some 2011 wrapup stats for the South Bay.
We did see some stats, and many were flawed. Your blog author went a little bit batty trying to figure out, "What are they trying to tell us here?" Permit a little rant.

The first battery of RE stats appears in an agent's ad early on in the mag. That 2011 wrapup does not provide median price data or anything regarding list/sale prices. The one and only data point on price: "PPF." (Price per foot, typically "price per square foot" or PPSF here at MBC.)
Is that average or median? Doesn't say. (It would matter.)
The "PPF" for MB: $714, which is up 5.90% from 2010, the ad says.
Isn't it curious that MBC reported MB's overall price trend was down 6% year over year, but this one stat showed the city up 6%?
Now, PPSF for a whole city? Combining SFRs and THs? Is that a useful measure? Of course not. PPSF is difficult to use within a neighborhood, and becomes less and less relevant the larger the area. We like to point to PPSF in certain circumstances, and we've even reported on average PPSF for the Tree Section and average PPSF for the Sand Section. But as the measure of a whole market?
We turned our glossy mag to the publisher's note, and found more head-scratching stats.
Reporting region by region for the South Bay, his column contains some data on MB. These are limited to SFRs.
Right away we saw a problem: 321 SFR sales? We've reported 320. In that 321 number, we know there's a duplicate. Uh-oh.
Then there's this: "Average selling price: $1,774,698." Wait: "Average" sale price? Isn't that subject to wild variation in a market like ours when you see lots of high-dollar sales?
Why, yes. That's why you almost never see "average sale price" used.
A friendly agent asked MBC last year for an opinion about the value of "average selling price" versus "median price." Our reply: "average sucks." Here's why.
The first problem is the misleading impression it gives. That figure is 22% higher than the median price for MB. So if you are considering buying in MB and wonder what the "typical" or "average" or "middle of the road" house might cost, median price tells you one thing ($1.450m) and "average" price tells you something rather drastically different ($1.775m). We'll go with median on this one.
And, yes, the "average" price is inflated in this case not just by high-dollar sales like the $10.9m Strand sale reported on the MLS last year. It can also be inflated by duplicates that occasionally appear in the MLS dataset – specifically, that $10.9m Strand sale reported on the MLS. It appears twice. That dupe adds $34k to the "average" selling price – so you have a bad measure made worse by failing to drop out a dupe.
Now consider just 2 off-market sales in MB. No, they're not in the MLS, by definition. But if they had put the $12.25m Strand sale and $16m Hill Section sale from last year (see "2011: A Year of Highs, Part II") onto the MLS, these would have added $87k more to the "average selling price." But they might have bumped up the median by perhaps $5k-10k.

Since we're talking about actual prices, let's bounce ahead to another ad in the mag. This one offers the "median list price" for MB as $1.445m, current as of the first part of January. Hey, at least it's a median, and that number is awfully close to the median sale price for 2011 ($1.450m), so this might actually be a good measure at times.
But really, who cares about asking prices? It's sale prices that matter. So the "list price trend" column of this particular data presentation doesn't impart much info. (MB's "list price trend" is flat/neutral, by this accounting.) And don't even get us started talking about the peculiarities of inventory early in the year – whoops, there we go already.
Now, the relationship of list prices to sale prices would be interesting, right? So back in the publisher's note we found a data point on this.
That's called the "Average Discount (List vs. Sale Price)." The discount is given as -4.55%.
Is that average gap between first list price and final sale price really 4.5%? Wouldn't it be remarkable if that were true? Most homes start out within 5% of their eventual sale price – this must be a market chock full of very smart sellers and agents, not to mention credulous buyers. Does this sound like the market you know?
Frankly, we don't buy it, but explaining why will take another wordy explanation. We'll take a look at how the list/sale (or ask/close) gap can be gamed, and has been, and how "average DOM" (yet another field we found in the mag) can be distorted, in a separate post shortly.
In sum, there are lots of data points you can use to summarize a market. Many, many, many of them tell you almost nothing. Some are actually misleading. (Are we up or down pricewise in the past year? It depends!)
Median prices are probably the best of the bad stats – the worst, that is, except for all of the others. And yet, with data showing MB down last year, we don't see anyone promoting the median price trend for our fair city. They're all pointing to something else instead. Why's that?
Please see our blog disclaimer.
Listings presented above are supplied via the MLS and are brokered by a variety of agents and firms, not Dave Fratello or Edge Real Estate Agency, unless so stated with the listing. Images and links to properties above lead to a full MLS display of information, including home details, lot size, all photos, and listing broker and agent information and contact information.
Based on information from California Regional Multiple Listing Service, Inc. as of May 3rd, 2024 at 6:55am PDT. This information is for your personal, non-commercial use and may not be used for any purpose other than to identify prospective properties you may be interested in purchasing. Display of MLS data is usually deemed reliable but is NOT guaranteed accurate by the MLS. Buyers are responsible for verifying the accuracy of all information and should investigate the data themselves or retain appropriate professionals. Information from sources other than the Listing Agent may have been included in the MLS data. Unless otherwise specified in writing, Broker/Agent has not and will not verify any information obtained from other sources. The Broker/Agent providing the information contained herein may or may not have been the Listing and/or Selling Agent.