By far the most frequent kind of question we get, online and in person, is a version of "how's the market really doing right now?" No wonder – it's essentially the question MBC has been addressing almost daily for 4 years, with data and anecdotes.
There's a certain expectation among people in the business of selling real estate or affiliated industries that things are going well now. It's a great time to buy. We've weathered the storm and things are looking up. Check out all the big-dollar sales, etc.
You know that take. It's almost timeless. We just didn't hear it much for a couple of years when we were truly in the dumps.
There's an undercurrent of anxiety, though, among some buyers and homeowners. What about this "double dip" housing recession they're talking about nationally? Case-Shiller's national index is lower now than in April 2009. Prices are down and year-over-year sales are down.
And what happens when the Fed stops its programs that have kept interest rates so low? Or when the conforming loan limit drops below $729k? Bears are suggesting that MB's next to drop.
The first question is how we're doing now, and are there any signs of deterioration? That, we'll address in detail in this post.
The next question is what the future might hold. Remember that MB was late to the housing crash in 2007-08, after it had spread to lots of lesser markets first. Those negative waves did hit MB, despite suggestions that our market was somewhat insulated. We started climbing out of the hole in late 2009, roughly at the same time as other markets.
So what's next? We'll ask you what you think in an upcoming post and poll.
As to the current moment, we dove into the data to look for trends. (We're relying on MLS data on SFR sales, so we don't have off-market sales in the dataset. Also, we're supposed to note that MLS data is "reliable but not guaranteed.") Here's our report.
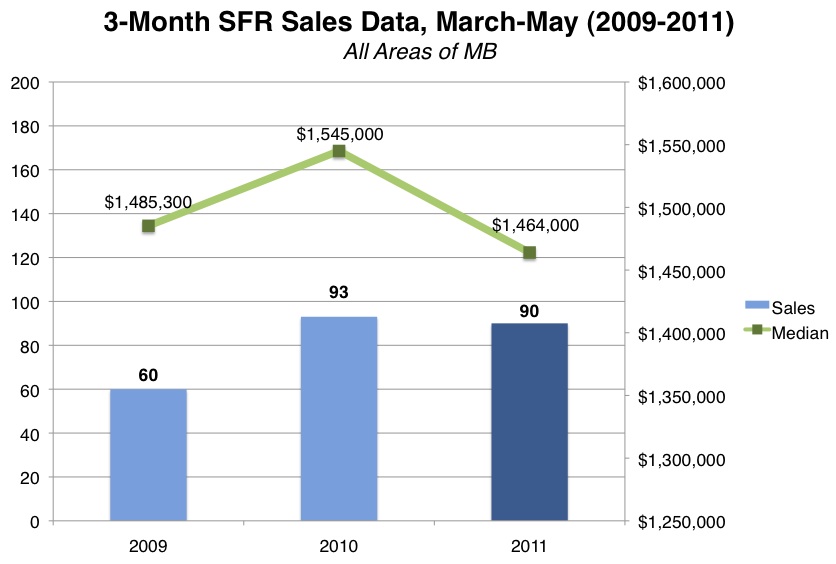
3-Month TrendsFirst we wanted to know how the past few months compare to last year.
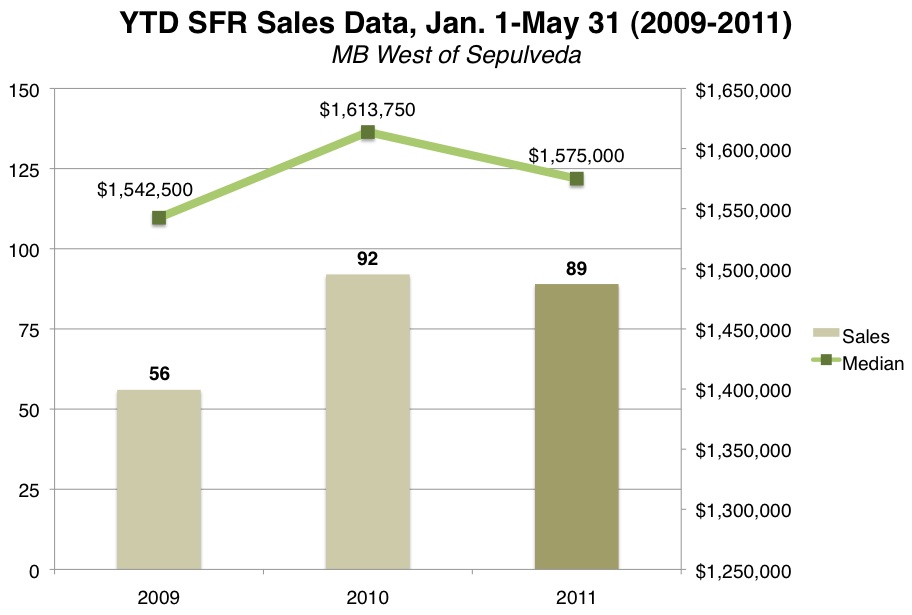
Both citywide and west of Sepulveda, SFR sales are very slightly down – essentially flat – when comparing the 3 months of March-May 2011 against the same period in 2010.
As our charts here show
(click any chart to enlarge), we had 4 fewer sales west of the highway, 3 fewer in MB overall.
The median price among the 70-ish sales west of Sepulveda was utterly flat from last year to this one, at
$1.6m.
Citywide, the median dropped 5% year-over-year when comparing these 3-month periods
(click chart to enlarge). Still, this is a small sample of less than 100 sales, and, as you will see, the dropoff levels off and disappears if we look further back.
This 3-month drop, then, might be an early warning or an anomaly. Probably not much of a concern yet.
We'll note that the sales pace for 2011 was substantially above the 2009 pace. For all MB, it was 50% above the number of sales seen during that very depressed year, and 60% higher west of the highway.
Comparing median prices with that crash year, there are mixed messages. MB overall is down 1% from 2009, while west of Sepulveda is up 3%. Hold onto that happy tidbit, though, because the median west of the highway doesn't compare as well when we look further back. [UPDATE: The initial percentage change calculations were incorrect and have been fixed.]
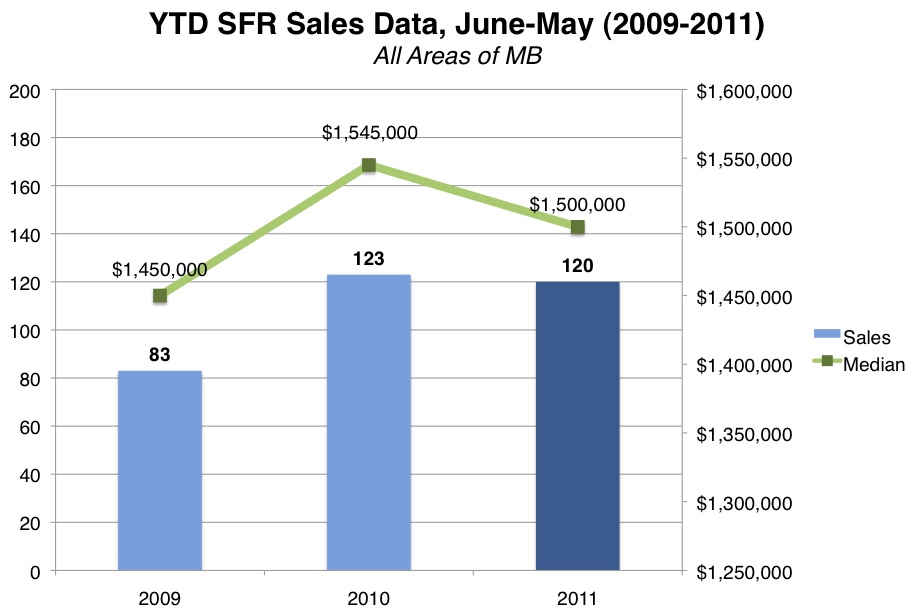
Year-to-Date TrendsFor both west MB and the whole of the city, we see a more notable, slight downtrend when comparing all of the first 5 months of this year with the same period for 2010.
Once again, sales are virtually flat: from 92 to down to 89 this year west of the highway, from 123 last year to 120 this year for all of MB.
However, median prices are down 2% for west MB and 3% for all MB when we look at these slightly larger sample sizes – nearly a half year.
If that trend holds through 2011, it could wipe out some gains made in 2010. As we've reported here separately, MB's citywide median price was up 4% for the complete year of 2010 compared to full-year 2009.
The YTD median, at
$1.5m even, is down from the full-year 2010 level of $1.525m.
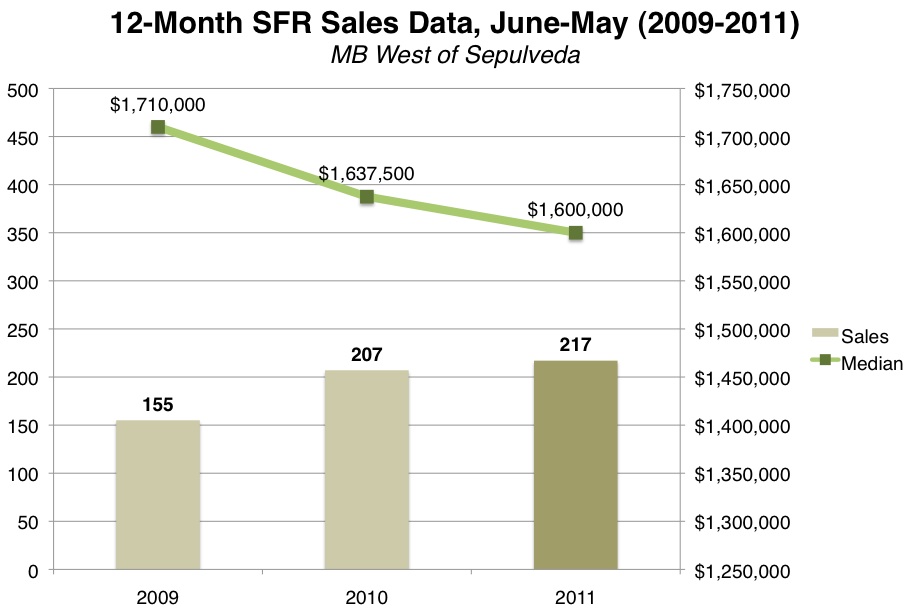
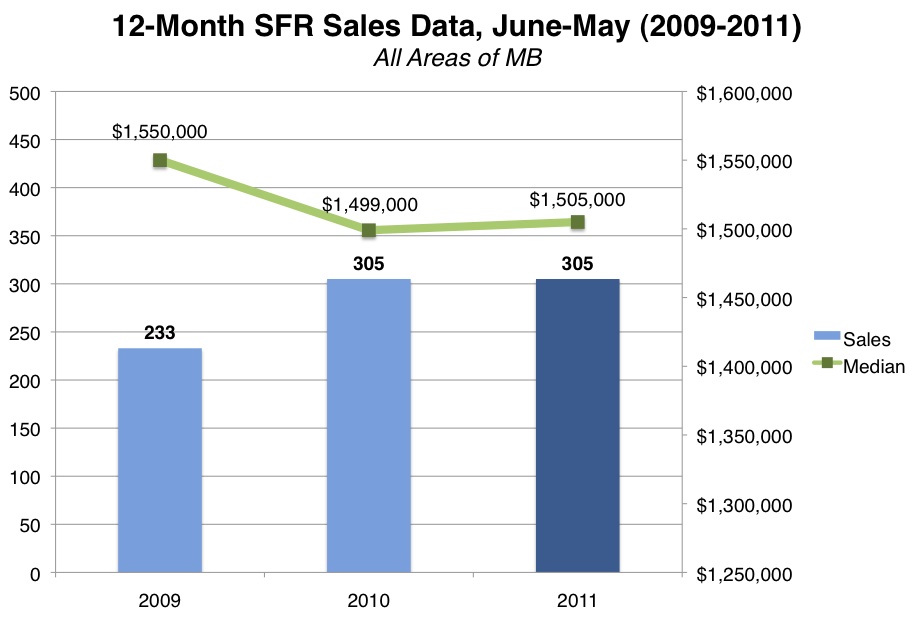
12-Month TrendsTo compare recent years against one another with the greatest sample sizes, we looked at 3 full years' worth of data. These charts examine 3 separate 12-month periods ending on May 31 of each year – so the "2011" figures represent parts of 2010 and 2011, concluding in 2011.
This is the first time you'll see the region west of Sepulveda performing worse than the city as a whole.
(Click any chart to enlarge.)To be sure, the jump up in total sales by 10 from 2010-2011 is an optimistic sign. And the 217 SFR sales west of the highway is a solid 40% jump over stalled-out 2009.
But the median price trend for west MB is an unhappy one in this comparison. At a lofty height of $1.710m in 2009 (again, this reflects sales in the second half of 2008 plus the first part of '09), the region's median is down to
$1.6m over the past year. (Coincidentally or not, this is exactly the same figure as we found for the past 3 months alone.)
That's a
6% median price drop over the past 24 months, surprising at a time when much of the local talk is about resiliency and, perhaps, increasing prices.
The whole of MB is doing better by this year-over-year comparison.
Sales were exactly flat when comparing the same 12-month periods ending May 31 in 2010 and 2011, at 305 sales. It's a jump of 31% over 2009.
The 12-month citywide median price is down just 3% from the figure for this time in 2009, and it actually just bumped up a tiny notch to $1.505m, a jump of $6k over 2010.
(Click graphic to enlarge.)This means that west MB, despite a higher median price, is down twice as much as the whole of MB over the same 2-year period.
Looking at everything together, you don't see any current evidence of real problems for the local RE market.
We're in the midst of a recovery of sorts that's trying to get to the 2-year point – sales volume is steady and prices are fairly steady, with a slight downtrend. Nothing like the alarming news you hear from other parts of the country. We'll soon see how well MB holds on.

 There's a certain expectation among people in the business of…