Just yesterday we took a look at 5 years' worth of sales data (2006-2010) for SFRs in our customary 3 subregions west of Sepulveda.
How about something new?
Here we'll pore over data on Sand Section townhomes and sales east of Hwy. 1. These data will cover the same period, Jan. 1-July 31, or 7 months, for each year,…
Just yesterday we took a look at 5 years' worth of sales data (2006-2010) for SFRs in our customary 3 subregions west of Sepulveda.
How about something new?
Here we'll pore over data on Sand Section townhomes and sales east of Hwy. 1. These data will cover the same period, Jan. 1-July 31, or 7 months, for each year, as we covered in the prior post.
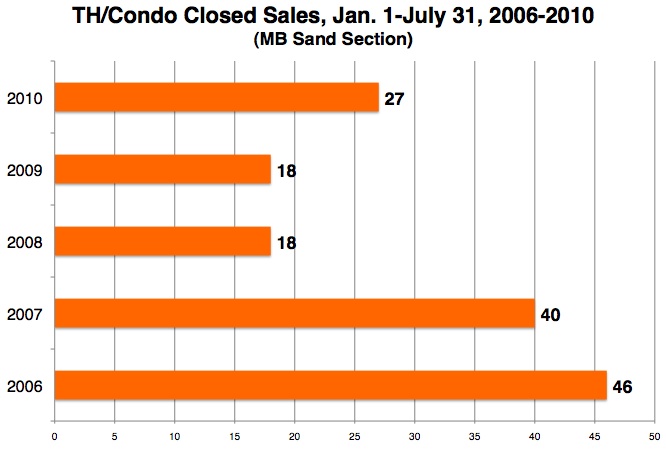
Starting out down by the beach, you may recognize the basic pattern for townhome and condo sales in the Sand. It's got much the same shape as MB SFR sales for the same period. (See "
Giving '07 A Run So Far.")
As with MB overall, the peak year was 2006, with a slight dropoff in 2007.
However, while MB SFRs sales dropped about one-third in 2008-09 from 2007 levels, beach-adjacent townhome sales fell by 55%, stuck at 18 sales each year – 1.5 per month.
Dealing with small numbers makes it possible to say something very cheery about 2010: Sales were up this year by 50%, going up 9 sales from 18 to 27.
For comparison, SFR sales in the 3 regions west of Sepulveda were up 40% this year over last.
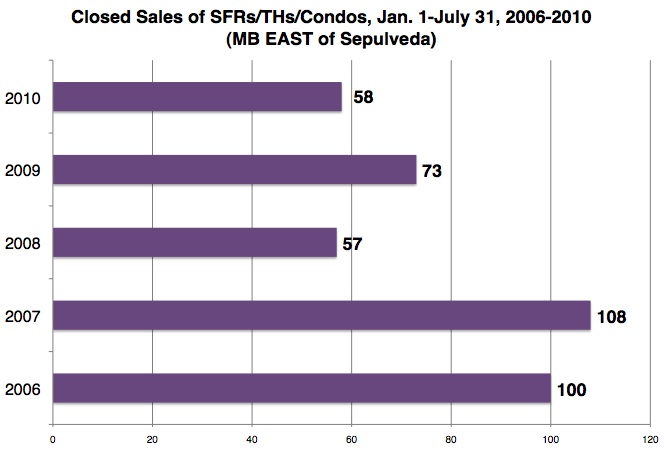
Now let's make one of our rare excursions east of Sepulveda. We're looking at ALL sales in the area, including SFRs, THs and condos, and including Manhattan Village. It's everything east of the highway.
Here the pattern isn't quite the same.
Someone forgot to ring the bell last year. While the rest of MB was in the doldrums, East MB had a better 2009 than a 2008.
Moreover, 2007 was the peak year among these 5 years we've selected, instead of 2006. That was just by 8 sales, but a peak nonetheless. For comparison, the 3 subregions west of Sepulveda had 7 more SFR sales in 2006 than in 2007.
But 2010 isn't stacking up so well right now. At 58 total sales to date (as of July 31), East Manhattan is seeing paltry 2008 numbers, off pace from its improvement in 2009 and down 46% from 2007's peak.
Is our little wannabe recovery skipping the eastern region?
Some readers have been asking for price data to go along with sales pace. A fair question, but that's a data challenge for a later post.
Please see our blog disclaimer.
Listings presented above are supplied via the MLS and are brokered by a variety of agents and firms, not Dave Fratello or Edge Real Estate Agency, unless so stated with the listing. Images and links to properties above lead to a full MLS display of information, including home details, lot size, all photos, and listing broker and agent information and contact information.
Based on information from California Regional Multiple Listing Service, Inc. as of April 29th, 2024 at 8:40am PDT. This information is for your personal, non-commercial use and may not be used for any purpose other than to identify prospective properties you may be interested in purchasing. Display of MLS data is usually deemed reliable but is NOT guaranteed accurate by the MLS. Buyers are responsible for verifying the accuracy of all information and should investigate the data themselves or retain appropriate professionals. Information from sources other than the Listing Agent may have been included in the MLS data. Unless otherwise specified in writing, Broker/Agent has not and will not verify any information obtained from other sources. The Broker/Agent providing the information contained herein may or may not have been the Listing and/or Selling Agent.