The year 2010 has seemed to feature a drumbeat of positive news about local RE.
But the close of the third quarter tamped that down a bit.
Two months ago, MBC published a stream of data tied to the closing of July 2010, when MB seemed to buck several local and national trends. (See "July '10 Sales in MB.") We looked…
The year 2010 has seemed to feature a drumbeat of positive news about local RE.
But the close of the third quarter tamped that down a bit.
Two months ago, MBC published a stream of data tied to the closing of July 2010, when MB seemed to buck several local and national trends. (See "July '10 Sales in MB.") We looked at July by itself, and grouped July with the 2 prior months to look at trends with a bigger n-size. One comment from that post:
More sales month-to-month and year-over-year, plus a rising median price? That's the trifecta.
Maybe the most startling conclusion: when we looked at the biggest possible selection of data, covering all sales of SFRs, THs and condos in all of MB in a 3-month period (May-July), we found a 17% rise in MB's median price year-over-year. It seemed 2010 had been a big comeback.
Now, a rollback.
 What a difference 60 days made.
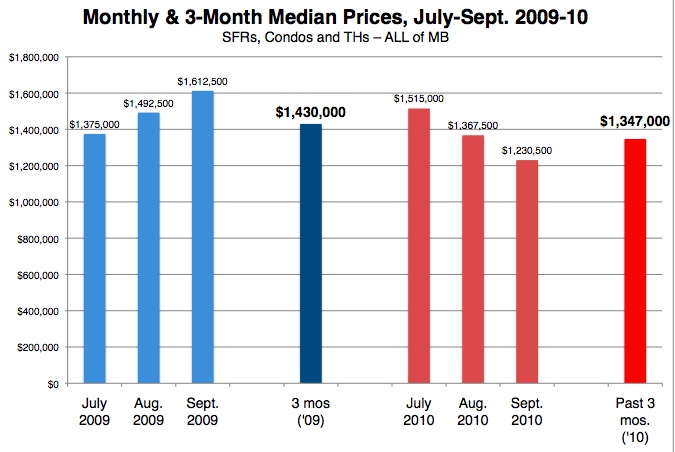
First, the one-month data. September's median prices for all of MB, and for MB west of Sepulveda, were down a bunch.
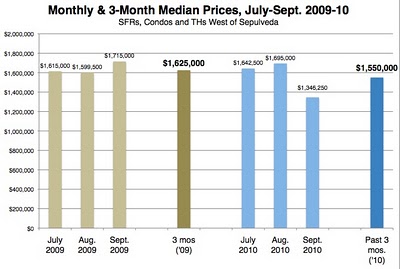
The median price citywide in Sept. 2009 was $1,612,500, but dropped 22% to $1,230,500 in Sept. 2010. Just looking west of Hwy. 1, the drop was 24% year-over-year, from $1,715,000 to $1,346,500.
We know that one-month medians are unreliable, but it's worth noting that the figures in July 2010 were up 2% west of Sepulveda and up 10% for all of MB, year-over-year.
The downtrend – or call it a settling – remains apparent when we expand the number of months under study.
As we did in looking at July 2010, we expanded the data search to cover 3 consecutive months, this time July-Sept. of 2009 and 2010 – the whole third quarter in each case. Still, we saw median drops by every measure.
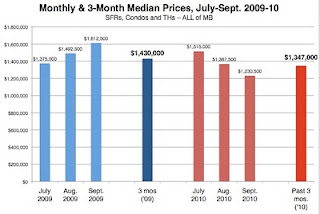
Citywide, the 3-month median price dropped 6%, from $1,430,000 to $1,347,000, comparing 2009-2010. (Click chart to enlarge.)
West of Sepulveda, the 3-month median dropped 5%, from $1,625,000 in 2009 to $1,550,000 this year.
Those are stark contrasts to the 17% year-over-year rise seen in May-July medians citywide, and a 10% median bump west of Sepulveda.
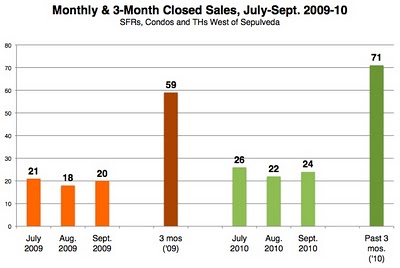
The volume of sales was comparable between 2009 and 2010 – 109 citywide this year in that 3-month period, 100 last year. West of the highway, we saw 71 closed sales this year, against 59 in the period last year.
Volume is up, prices are down.
With these seemingly wild fluctuations, the next question is: How about a bigger n? How about year-to-date sales?
Finally, here, we have some positive news. It's just not as positive as our last report on YTD median prices.
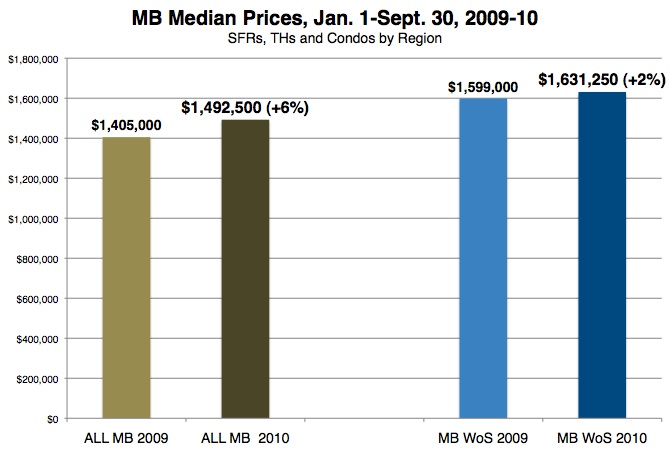
Looking citywide at all sales of SFRs, THs and condos, from Jan. 1-Sept. 30, the number of sales was up 22% over 2009 levels, from 243 closed sales to 297 this year.
West of the border, the jump was 36%, from 153 to 209 sales through the end of this year's third quarter. That's clearly some kind of rebound.
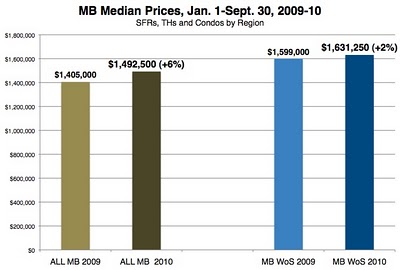
And finally we see median price increases when looking at sales from Jan. 1-Sept. 30: +2% west of Sepulveda (to $1,631,250 this year) and +6% citywide (to $1,492,500). (Click graphic to enlarge.)
That 6% bump is more modest than the 10% increase we reported in September. (See "Median Price Bouncing Back.")
The prior report looked at sales through late September, not quite month's end, but only referenced SFR sales, leading to a citywide median figure of $1,599,500. We also compared against the full-year data from 2009 and prior years. That decision that seemed reasonable at the time, but may have made for an imperfect comparison.
Has the rally petered out? Is this settling a normal, cyclical process? Is there something about the mix of homes being sold later in the year that is driving down medians?
We suspect that all of those questions have partial "yes" answers. So what does our fourth quarter hold in store?
Please see our blog disclaimer.
Listings presented above are supplied via the MLS and are brokered by a variety of agents and firms, not Dave Fratello or Edge Real Estate Agency, unless so stated with the listing. Images and links to properties above lead to a full MLS display of information, including home details, lot size, all photos, and listing broker and agent information and contact information.