We have found one interesting stat that rather simply illustrates the 2019-23 real estate market in Manhattan Beach.
We'll drop that data in right here, then explain what we see when looking at the chart. (Some of y'all are going to take one glance at the chart, "get it" and that's that, but we like to offer the long form as well.)
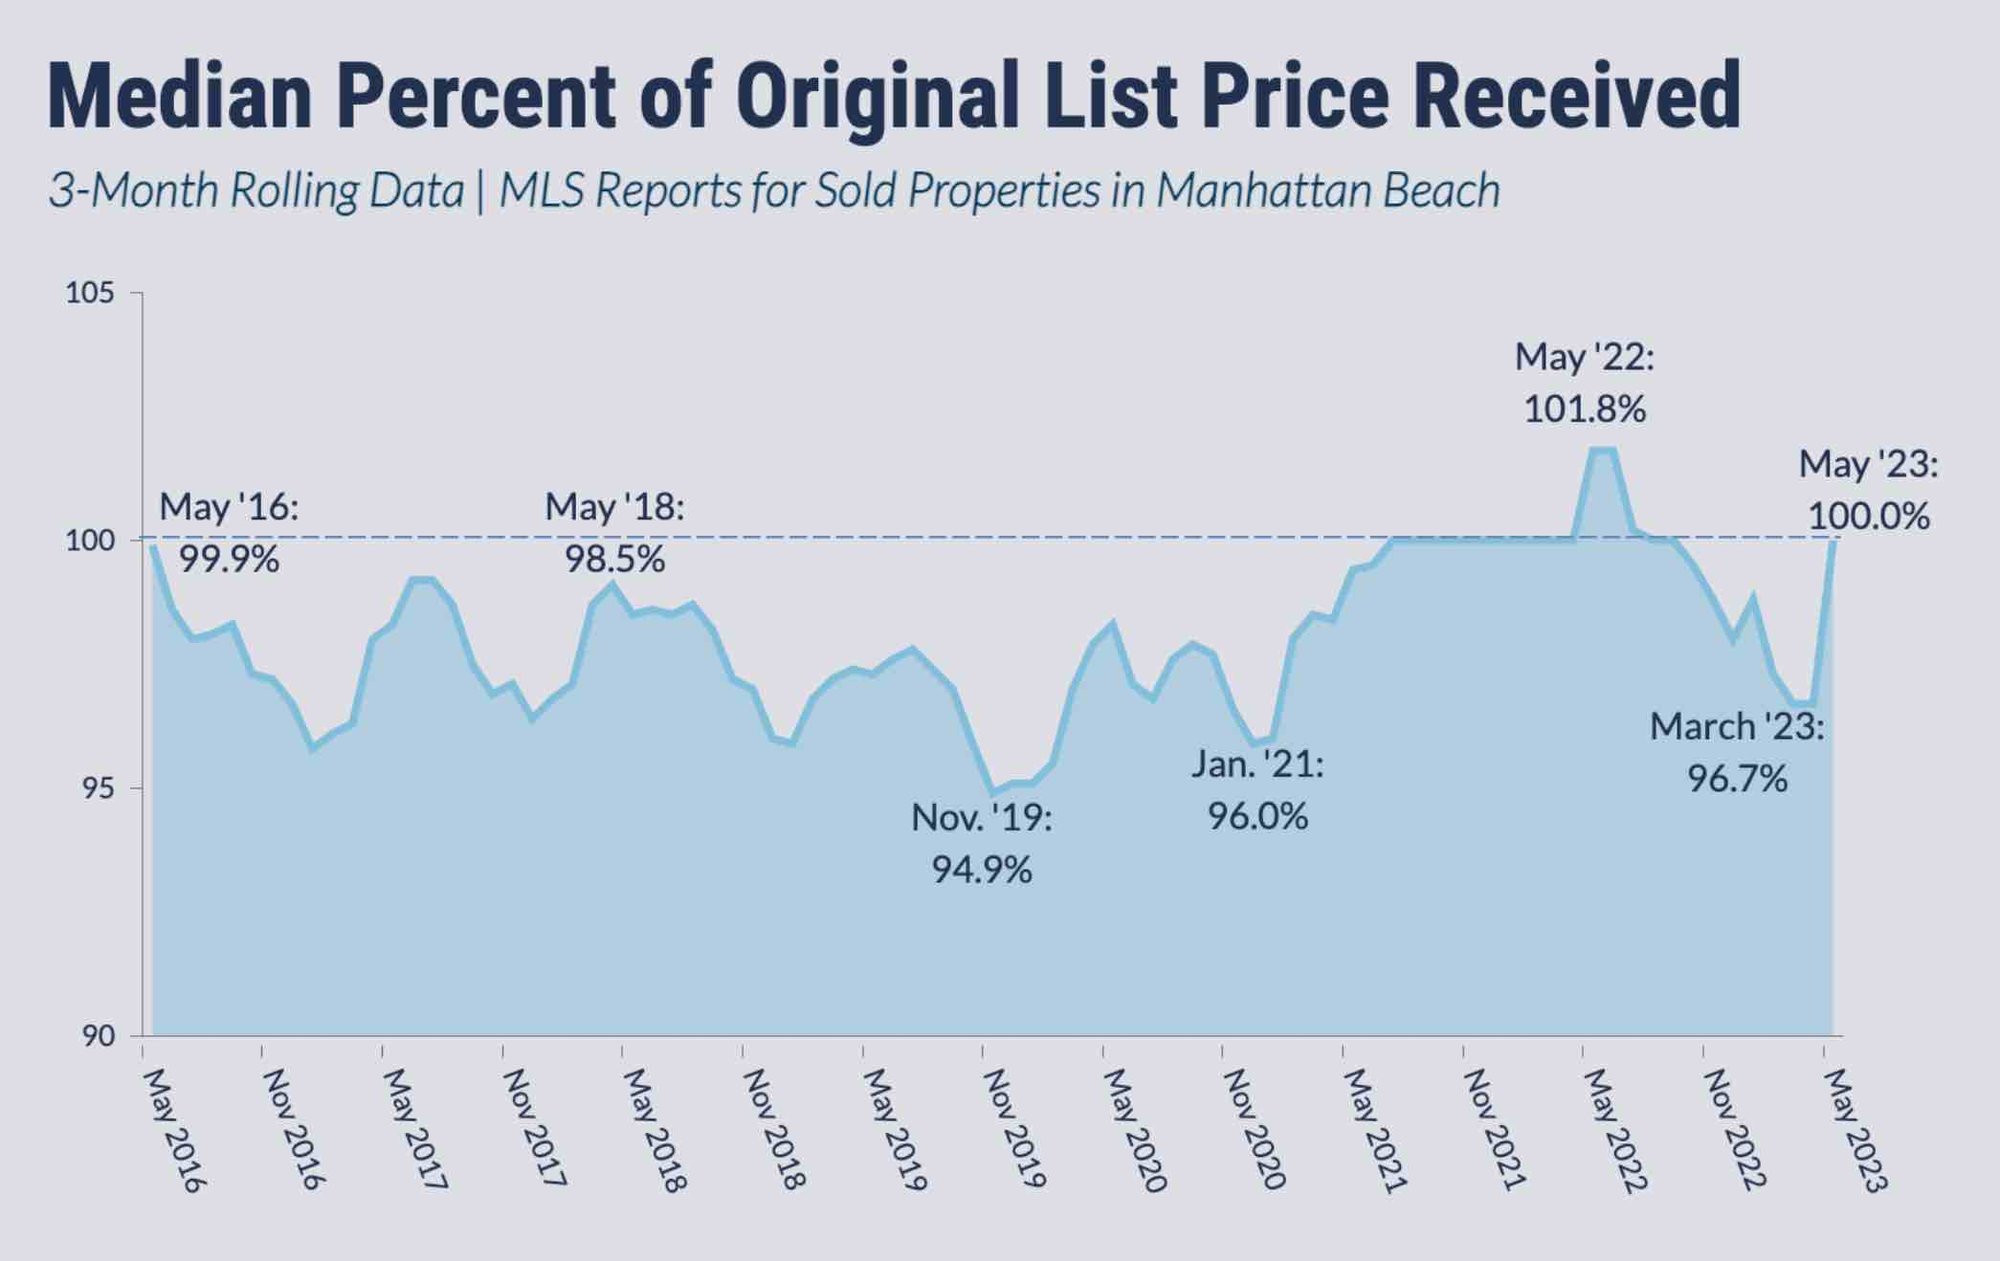
Obviously this chart covers 7 full years, but it's the portion from late 2019 forward that most intrigued us, and particularly the tail end of this chart, up to the end of May 2023.
The single stat we are going to look at here is the ratio of the original asking price to the sold price.
It answers the question: How close were sellers and their agents to reading the current market value of their properties?
Specifically, we're focused on the median list/sold ratio, meaning half the homes got more, and half the homes got less, of the original asking price. (As is the case with median home prices, the median is usually superior to the average, because it is not going to be influenced as much by outlier data [e.g., the one house that sold 30% under the start price].)
The chart shows that when the real estate market is performing somewhat normally, it's typical of homes to sell within 5% of their start prices.
As you can see in our chart, something like 96-97% would be pretty common for a median list/sale ratio here in town.
But things got soft in late 2019, which became the first year that median home prices dropped in Manhattan Beach in quite a while.
The chart shows how the market was struggling in late 2019, with the median list/sold ratio hitting the lowest point on our 7-year chart, at 94.9%.
By then, people expecting a buyers' market in Spring 2020. Along came COVID-19, prompting expectations of an all-out real estate market crash. Instead, it was the start of a wild rally in local real estate, both in prices and volume of sales. (Thank you, tiny interest rates!)
The list/sold ratio data both rose and fell in 2020, but a sustained rising trend took hold by 2021.
For much of 2021 through early 2022, the list/sold ratio in Manhattan Beach was 100%!
At a glance, that kind of figure strongly suggests that many homes were selling over asking price, and hints at a frenzy that even sellers and listing agents just can't keep up with. They kept guessing low with their asking prices.
There was no point in the prior 6 years when the ratio was at 100%, though May 2016 was very close at 99.9%.
And then May 2022 saw 101.8%!
That figure is without precedent going back to 2008. (That's as far back as our data goes.)
There were some times in 2013-15 when the ratio was 100%, but never higher.
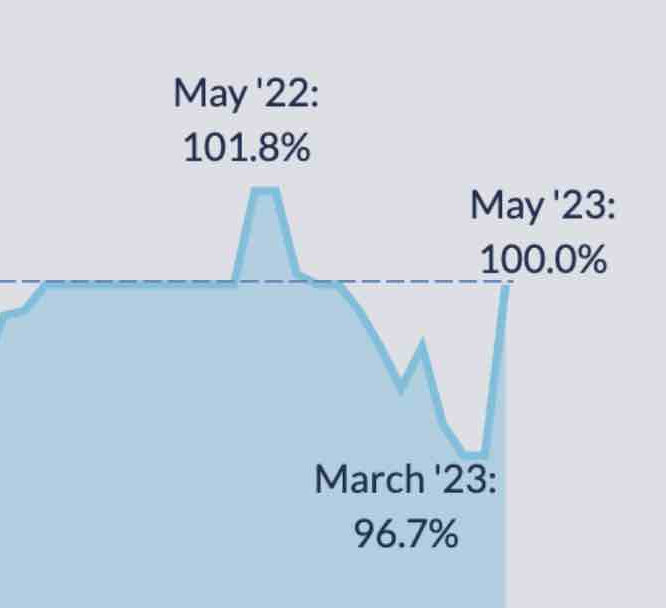 Midyear last year, the music stopped, and the market became unstable. (Booooo, loss of tiny interest rates!)
That instability is clearly illustrated by the ski slope downward from June 2022-March 2023. After several months at or above 100%, suddenly the figure was under 97%.
This Spring, things have firmed up again, and at least those homes that do come to market are often selling at higher prices, sometimes with multiple offers.
The immediate spike to 100% again in May 2023 is a data signal that tells you the same thing that we have been saying on the blog here throughout the late Spring: The market came back, prices stopped dropping as multiple offers became a thing again, and expectations of a buyer's market in Manhattan Beach were once again dashed.
If we saw this in one-month data, we'd be less convinced, but we've smoothed things out with a running 3-month total. May's figure includes all of March, April and May, underscoring how the Spring market rapidly recovered.
Unanswerable question: How would prices be performing if there were a normal amount of inventory, instead of a chronically constrained amount? Discuss.
--------------------------------------------------------------
Nerdy notes:
Chart data comes from the California Regional Multiple Listing Service, Inc., InfoSparks © 2023 ShowingTime.
All charts custom crafted by Dave Fratello for MB Confidential, and copyrighted.
Please see our blog disclaimer.
Listings presented above are supplied via the MLS and are brokered by a variety of agents and firms, not Dave Fratello or Edge Real Estate Agency, unless so stated with the listing. Images and links to properties above lead to a full MLS display of information, including home details, lot size, all photos, and listing broker and agent information and contact information.

