All kinds of records are being set all around us in local real estate.
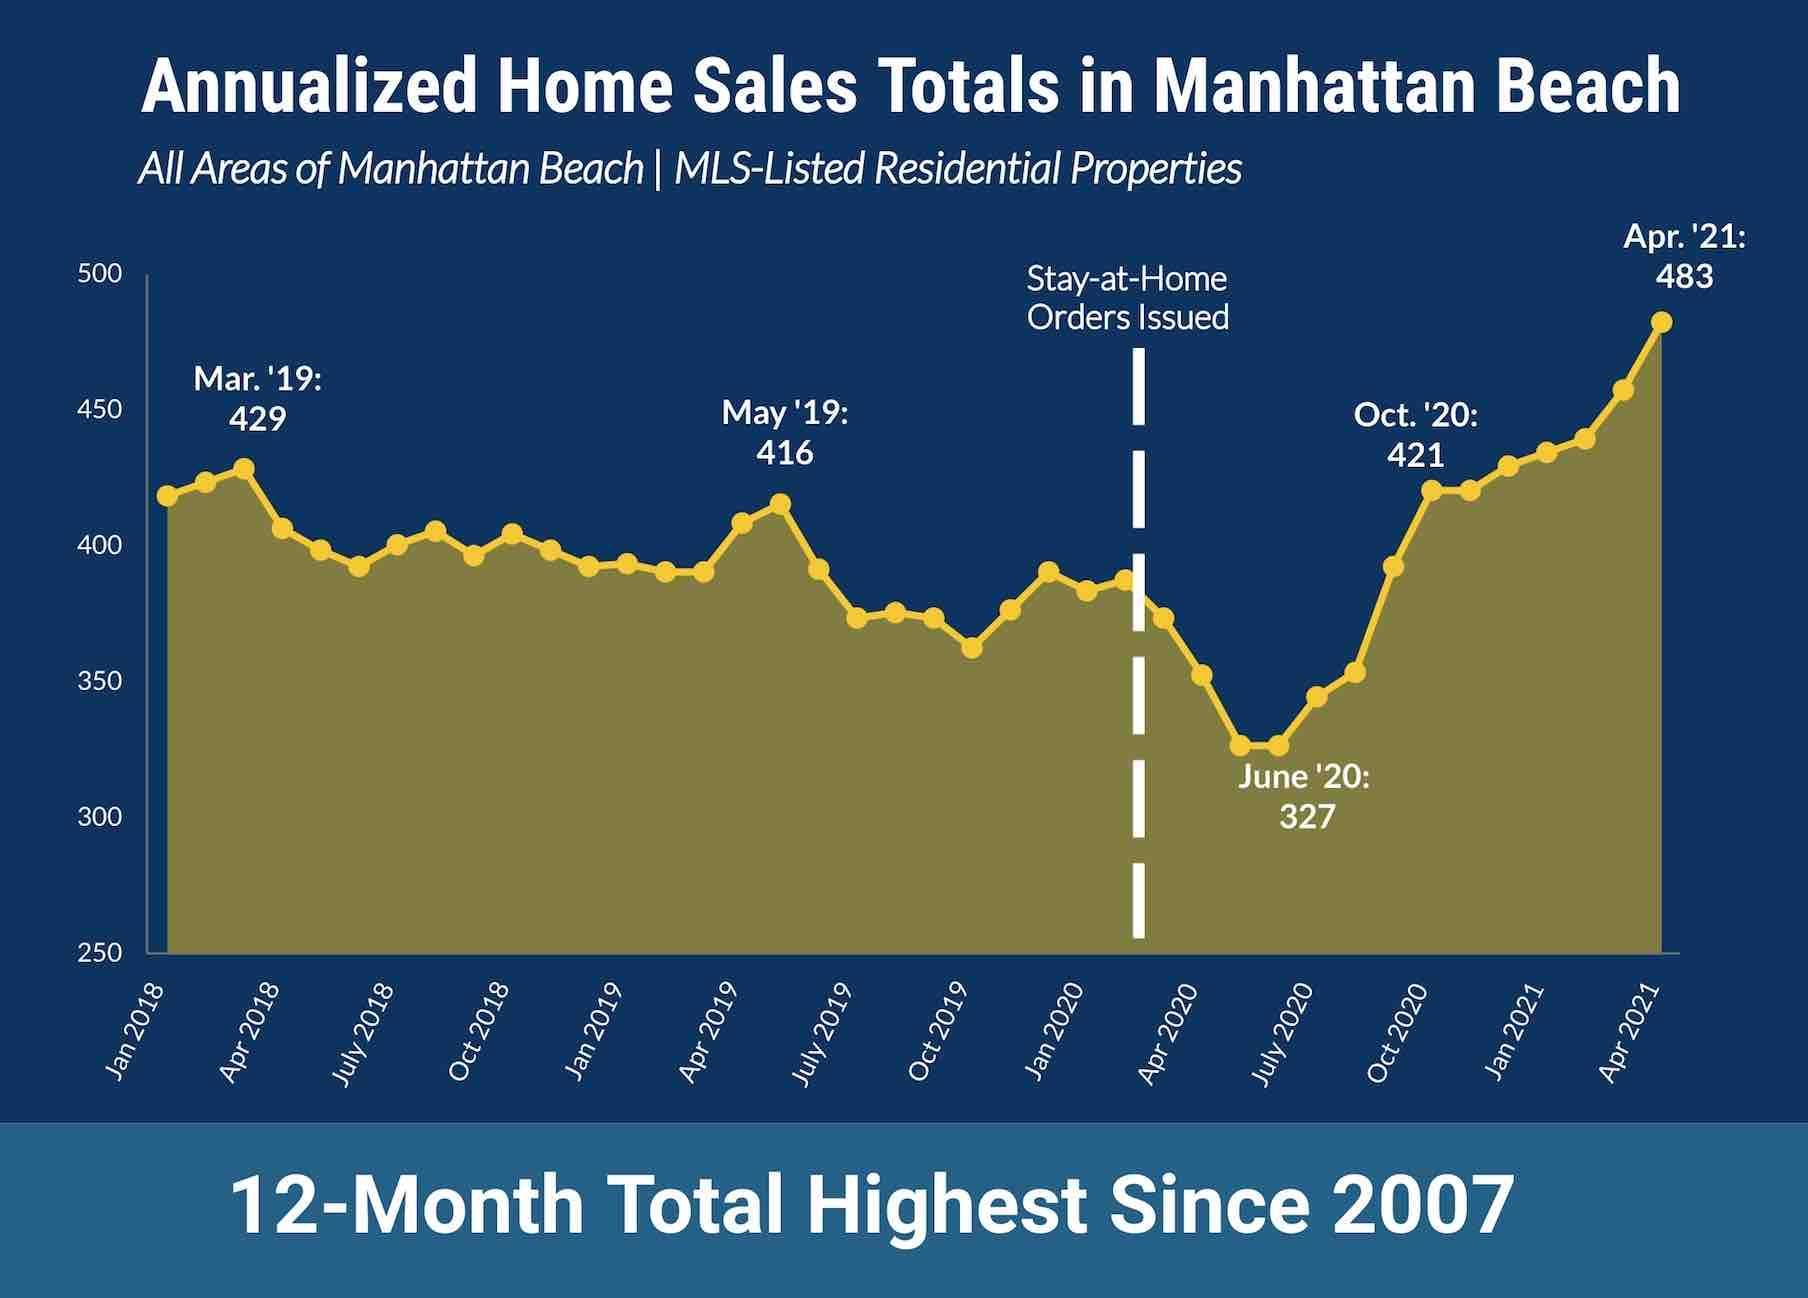
For one, far more home sales have closed in the 12-month period ending April 30 that at any point since 2007.
Our new chart here shows you that 483 home sales closed in Manhattan Beach between May 1, 2020 and April 30, 2021.
…
All kinds of records are being set all around us in local real estate.
For one, far more home sales have closed in the 12-month period ending April 30 that at any point since 2007.
Our new chart here shows you that 483 home sales closed in Manhattan Beach between May 1, 2020 and April 30, 2021.
Incredibly, this huge number still includes a couple/few months of a slower sales pace in mid-2020. Since we are right in the middle of the Spring market now, it'll be no surprise if the May and June figures to also carve out new peaks.
While this chart only shows a bit more than 3 years' worth of data, we did look further back. We found a burst in early-mid 2017, but never more than 443 sales for a 12-month period. A few months of late 2012-early 2013 also got into the middle 400s, cresting at 458.
To find a figure higher than the current 483 sales in 12 months, we have to go all the way back into 2006-07, a frenzied period that also happened to be the end of the early-aughts bull market.
Closer to the current moment, we looked back to one year ago. We had just closed the books on April 2020, and noted the substantial downtrend in 12-month annualized sales then (352 at end-April 2020). As we observed in that post:
"none of these trends are permanent, and they're easily understood in the context of a pandemic that has chilled real estate market activity. Whenever it can be said that the market is more 'normal,' we may see pent-up demand deliver higher-than-average sales in later months."
Folks, here are your "higher-than-average sales" right now!
The median price is up, too, but we'll cover that separately.
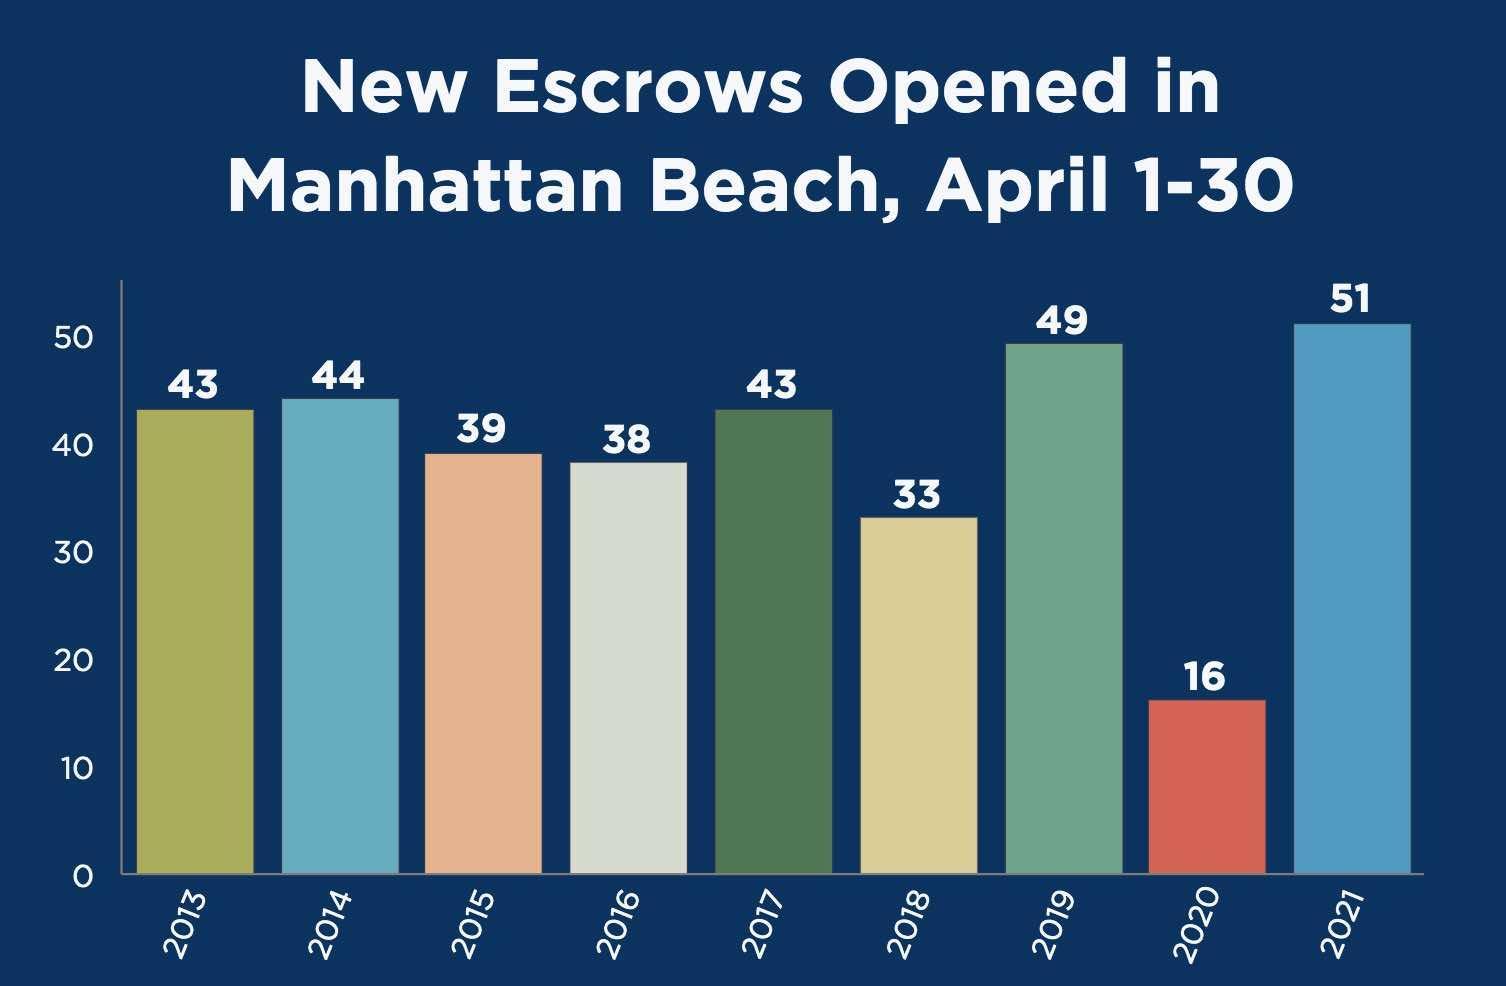 For a snapshot of current market activity, as opposed to closed sales, April also saw more new escrows opened than in any recent year.
With 51 new deals inked within the month, this year narrowly beat out 2019's surprisingly strong figure of 49.
It's not even fair to mention April 2020's 16 new deals, is it?
(Word to the wise, though: You always hear the advice that it's great to be a buyer when everyone thinks it's too scary. Don't you think folks who tied up a property at the scary time of April 2020 are feeling like they did pretty well by now?)
We like to feature a few closed sales each period, so here are a few notables:
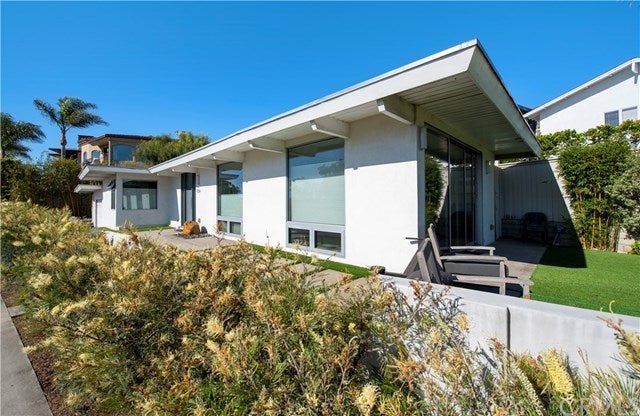 224 N. Ardmore (2br/1ba, 1146 sqft., 5400 sqft. lot)
This is a fully modernized Hill Section cottage. The greatest part of the value, obviously, was in the land.
Dave and Edge brokered an off-market sale for the property, closing it for $3.100M near the end of the month.
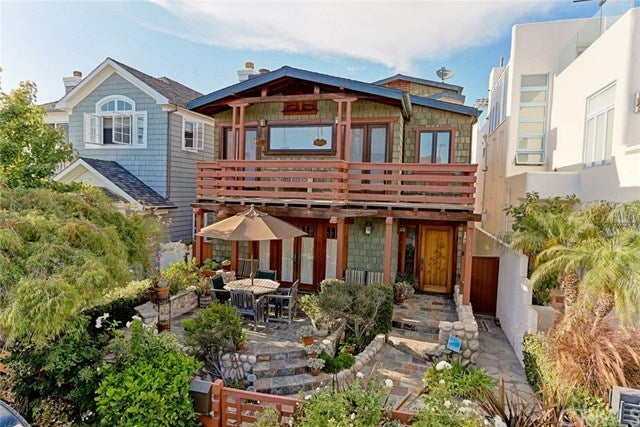 Down in the South End of the Sand Section, we took note of the closing at 539 4th (4br/3ba, 3200 sqft.).
The unusual beach-area Craftsman had tried to sell in 2019 (last at $3.200M) and 2020 (last at $3.100M).
They launched again at $3.100M, but this time, instead of getting stuck on the market for a few-to-several months as before, the home sold for more than asking. Quite a bit more: $266K, closing at $3.366M.
Meantime, in the Martyrs area, on a treasured cul-de-sac street, 673 17th closed for $3.400M, $101K over asking.
Here's the rest of our local real estate market update report for the period ending 4/30/21:
> 83 active listings as of 4/30/21 (+3 from 4/15/21)
> 57 SFRs (+5)
> 26 THs (-2)
See the Inventory list as of 4/30/21 here, or see the MB Dashboard for up-to-the-minute data.
Active listings by region of Manhattan Beach in this report:
> Tree Section: 17 actives (+5)
> Sand Section: 39 actives (-5)
> Hill Section: 9 actives (+3)
> East MB: 18 (Flat)
We're also providing a report on closed sales by region of MB.
Sales data, including PPSF for all properties, are organized by sub-region of Manhattan Beach.
Here's a link to the spreadsheet: "MB Pending/Sold as of 4/30/21".
Please see our blog disclaimer.
Listings presented above are supplied via the MLS and are brokered by a variety of agents and firms, not Dave Fratello or Edge Real Estate Agency, unless so stated with the listing. Images and links to properties above lead to a full MLS display of information, including home details, lot size, all photos, and listing broker and agent information and contact information.


