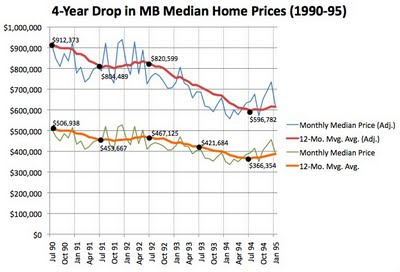
 Home price declines in MB in the last major down-cycle spanned 4 years.
There were bumps, including an identifiable rising median trend during the second year, before the downward trend resumed convincingly. (Click graph to enlarge.)
By the end of the 4-year burn, median prices were down 27.7% in nominal terms (the…
 Home price declines in MB in the last major down-cycle spanned 4 years.
There were bumps, including an identifiable rising median trend during the second year, before the downward trend resumed convincingly. (Click graph to enlarge.)
By the end of the 4-year burn, median prices were down 27.7% in nominal terms (the dollars of the day), and 34.6% in inflation-adjusted dollars. (Using 2007 dollars in this case.)
We're looking back at the data now, previously produced for one of MBC's "Top Stories," in light of the simmering discussion around town – and here at MBC – as to what's going on with median prices today.
Are we down? Are we up? Have things turned around?
The history of the last decline suggests that down-cycles, once they take hold, grind on despite glimmers of hope offered along the way.
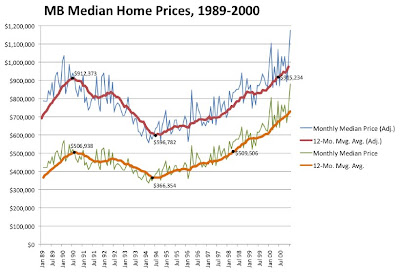
 The graph of 90s declines above is a new, smaller slice of data previously published in "The 90s: What a Drag," which contains a more extensive discussion of the data source and adjustments. (Also the source of this fuller graph to the right.)
The main things to know are that the thicker red and orange lines represent 12-month moving averages of monthly median price data, provided by DataQuick.
MBC has also published charts showing the recovery and bubble years, most completely in "The Whole Enchilada."
Local median-price data for those stories ended in January 2008, and MBC has not published comparable, updated figures, but we'll have a new dataset at the end of Q3 2009 for stories in October.
How should we interpret these 90s figures today? Really, who's to say whether history repeats itself? This is not the 1990s we're living in, after all.
Back in the 90s, we had just seen a historic housing bubble, followed by a recession triggered – at least in part – by the collapse of lending institutions harmed by the popping of the house-price bubble. The nation had recently elected a young new Democrat to steer the country out of the mess.
So you see, a lot of things then were, er, different.
Today, for instance, we have historically low interest rates. Still. That helps, right?
Please see our blog disclaimer.
Listings presented above are supplied via the MLS and are brokered by a variety of agents and firms, not Dave Fratello or Edge Real Estate Agency, unless so stated with the listing. Images and links to properties above lead to a full MLS display of information, including home details, lot size, all photos, and listing broker and agent information and contact information.
Based on information from California Regional Multiple Listing Service, Inc. as of April 27th, 2024 at 12:15am PDT. This information is for your personal, non-commercial use and may not be used for any purpose other than to identify prospective properties you may be interested in purchasing. Display of MLS data is usually deemed reliable but is NOT guaranteed accurate by the MLS. Buyers are responsible for verifying the accuracy of all information and should investigate the data themselves or retain appropriate professionals. Information from sources other than the Listing Agent may have been included in the MLS data. Unless otherwise specified in writing, Broker/Agent has not and will not verify any information obtained from other sources. The Broker/Agent providing the information contained herein may or may not have been the Listing and/or Selling Agent.

 Home price declines in MB in the last major down-cycle spanned 4 years.
