For a couple years there, no one could get enough of Manhattan Beach real estate.
Low rates drove a real estate market surge everywhere, but there was something extra special here.
 The onetime buying frenzy has vanished now, with a steep dropoff in sales citywide. What goes up, apparently must come down.
…
For a couple years there, no one could get enough of Manhattan Beach real estate.
Low rates drove a real estate market surge everywhere, but there was something extra special here.
The onetime buying frenzy has vanished now, with a steep dropoff in sales citywide. What goes up, apparently must come down.
Home sales year-to-date in Manhattan Beach are now below 2009's totals. From Jan. 1-Nov. 15, we've seen 289 sales close. In 2009, the total for the same period was 293.
As we've joked before, if you're a real estate statistic, you do not want to be compared to a 2009 stat. Yikes.
Now let's look at the surge, recent drop, and then some signs of hope for a better 2023.
2020's Rocket Rise
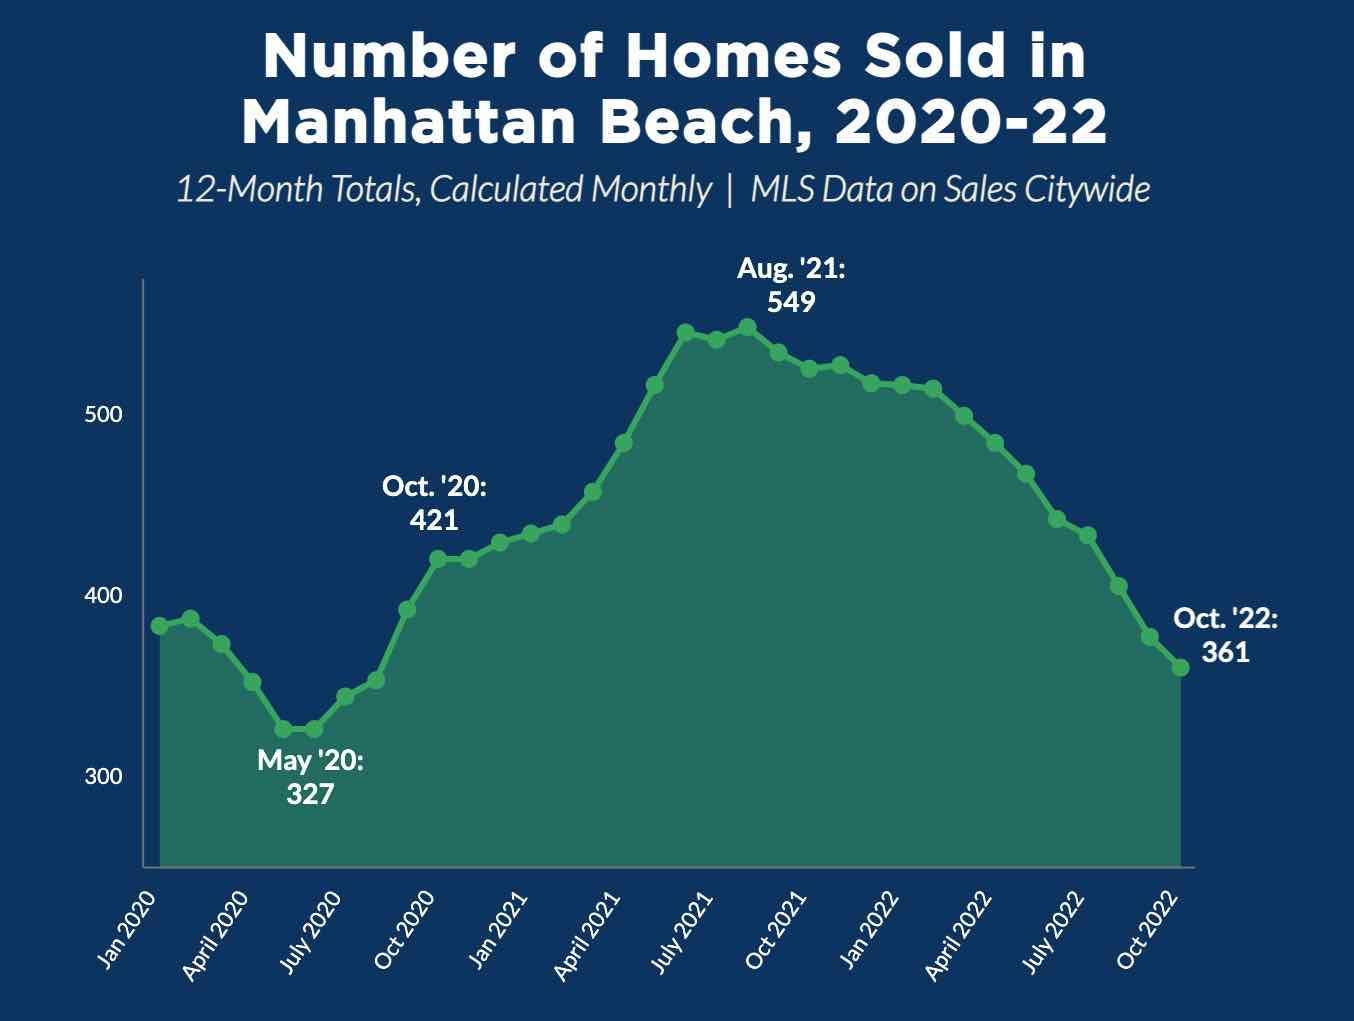 First, the 2020-22 surge and drop.
We're looking here in our chart at running 12-month totals for the number of home sales in Manhattan Beach. We start with a major dip in early-to-mid 2020, which traces back to the near-absence of sales for a couple of months during the early covid shutdowns.
From that low point, it was off to the races.
The volume of sales shot toward the moon, peaking at 549 in Summer 2021. That sales total is far more than we see in data going back a full 15 years.
That peak turned out to be like that flat, quiet part at the top of a roller-coaster ride. Once the front wheels of the carriage begin to grab the downslope, it's hold-on-to-your-hats time.
Every month for a year now (since November 2021), the cumulative number of sales over 12 months has dropped.
October 2022 ended with 361 closed sales in a year, down 32% from the 528 recorded as of Nov. 2021.
--------------------------------
Nerdy Note: To dramatize data in all graphs in this post, we use 250 sales as the "zero" line. Don't worry, sales aren't evaporating.
--------------------------------
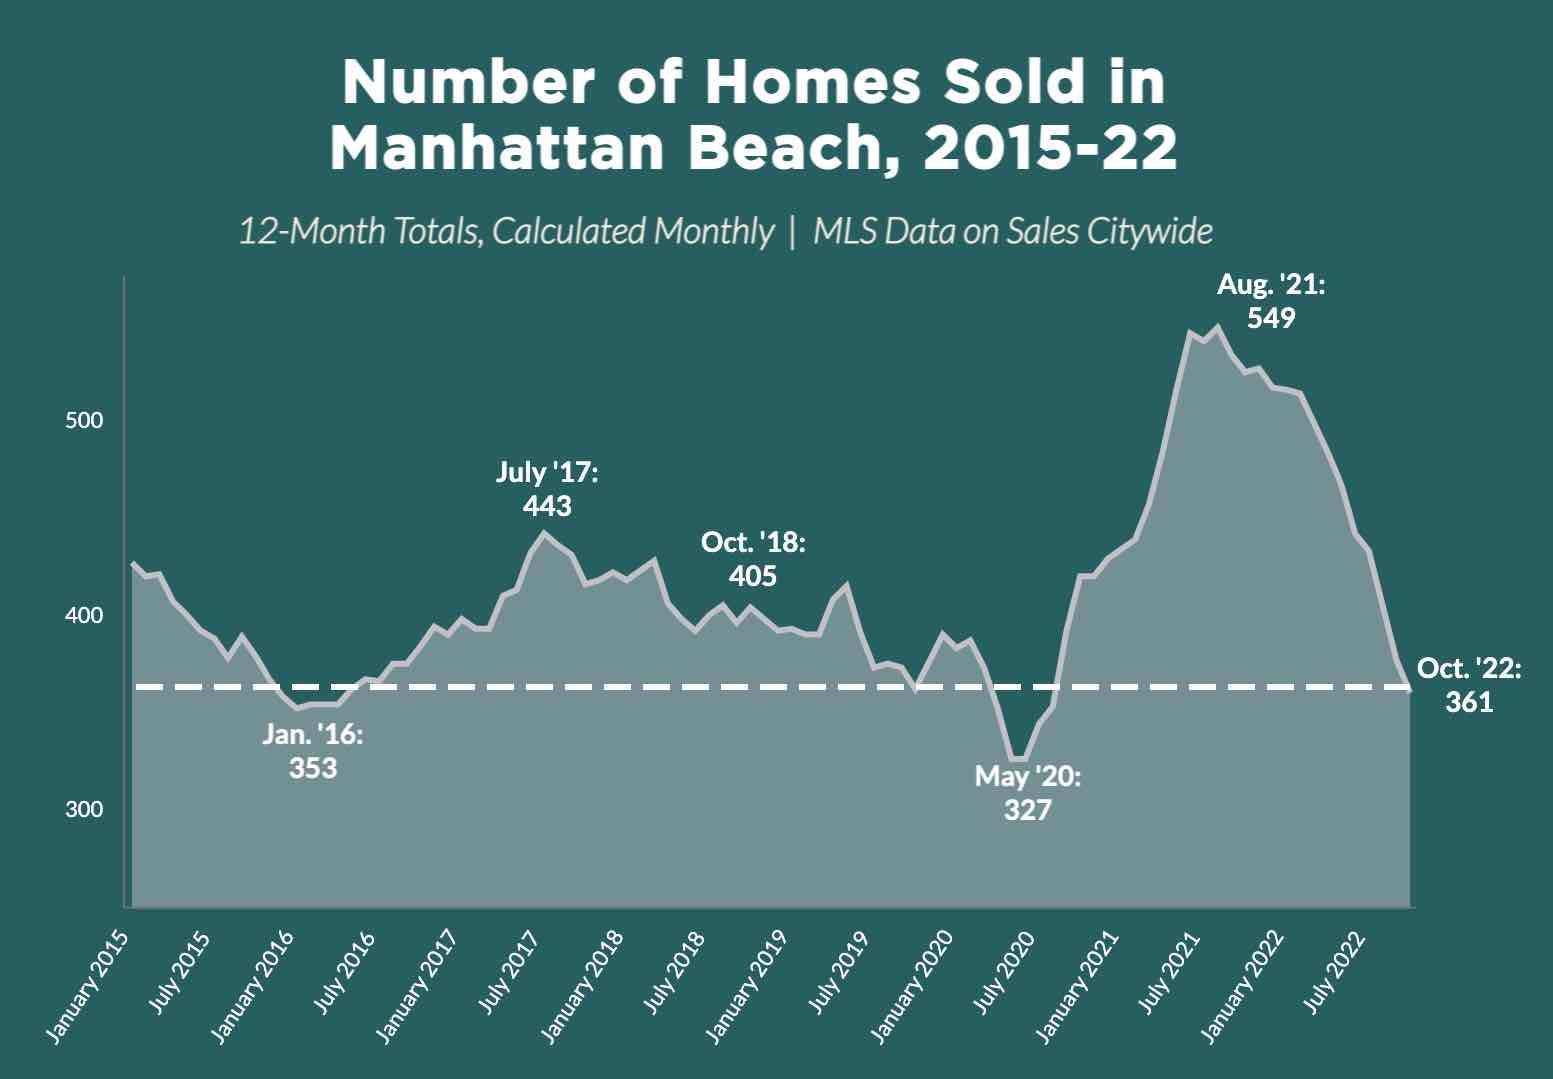 Let's pan back a bit and look at more data.
Because this second chart shows 8 years' worth of sales figures, you'll see we "squeeze" the 2020-21 peak a bit, and it looks even more dramatic.
The peak is higher, and the recent low points are lower, than we've seen for most of the time going back to 2015.
To find a time with fewer sales that the October 2022 figure of 361 sales in 12 months, we have to go back to late 2015-early 2016. January 2016 was a low point at 353 sales.
There was nothing too gnarly going on in the market at that moment. Arguably there may have been a bit of a "hangover" from the first big rally years of 2013-15.
But look to that time, also, for some hope.
The next 18 months, from that trough in early 2016 till July 2017, saw a sustained increase in total home sales in Manhattan Beach. We ended up with a new peak of 443 sales as of July '17, which stood as a recent record until beaten in March 2021 (with 458 sales).
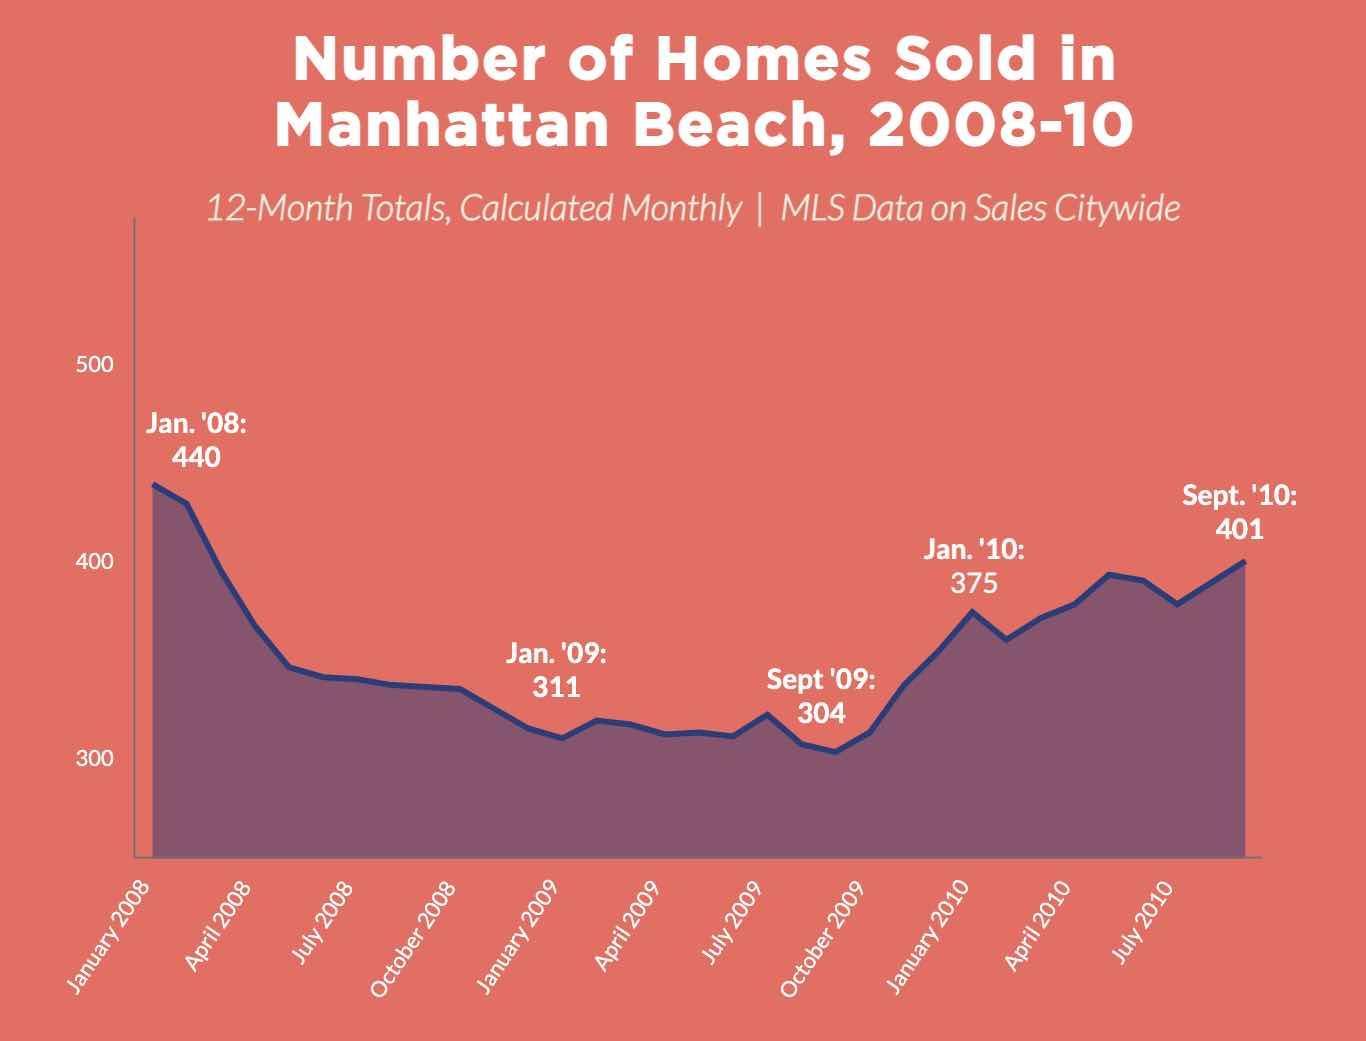 You'll see something similar in the post-housing crash data.
Yes, the slide in sales from 2007-08 into 2009 was grim.
From Jan. '08 to Jan. '09, the 12-month sales total fell by 29%.
The bottom was much lower than we see today, with sales hovering in the low 300s throughout much of 2009.
(Hey, that's still 300+ sales per year at a time when "no one" was buying or selling.)
We have often noted that the Manhattan Beach market clearly began to turn around in Q3 2009. Here, you see that in data showing a fairly quick rise in the number of sales from a low in Sept. 2009 (304) to a pace almost 25% greater within a few months.
Yes, by January 2010, the city was showing 375 sales within a year - much of that coming out of late 2009 - and soon Manhattan Beach was back to a steady pace of nearly 400 sales per year.
Looking Ahead for '22-'23
Data like this will keep coming out over the next 6 to perhaps 18 months, leaving plenty of room for interpretation.
We've lost the excess demand, inventory still hasn't recovered, and now prices are in the crosshairs.
Here at MBC, we've been conveying as clearly as we can that homes selling now are going for less than they would have before. It's not much of a daring opinion. We're seeing it on the ground, and anyone can see it as homes come back to market asking less than they were before.
Still, we wouldn't bet against an upsurge in home sales as Spring 2023 gets rolling. We're already at a pace that is lower than average. It will bounce back.
Savvy sellers - people who need to, or want to, sell homes regardless of conditions - are simply going to meet the market where it's at to get a property sold. Prices will reset to a point where buyers like what they see, and the market will move again.
If you were looking to sell only when your home was worth the most it was ever worth, eh, sorry, you missed that. But most home sellers will still do very, very well, likely keeping much of the gain from the past 3 years.
Please see our blog disclaimer.
Listings presented above are supplied via the MLS and are brokered by a variety of agents and firms, not Dave Fratello or Edge Real Estate Agency, unless so stated with the listing. Images and links to properties above lead to a full MLS display of information, including home details, lot size, all photos, and listing broker and agent information and contact information.


