As we continue to scan for ways to evaluate this year's Spring real estate market in Manhattan Beach, we decide to take a look at data on how long it takes to sell a home here.
The rub: After rising for 6 straight months, the median number of days on market that a home needs to get under contract has dropped to just 16.
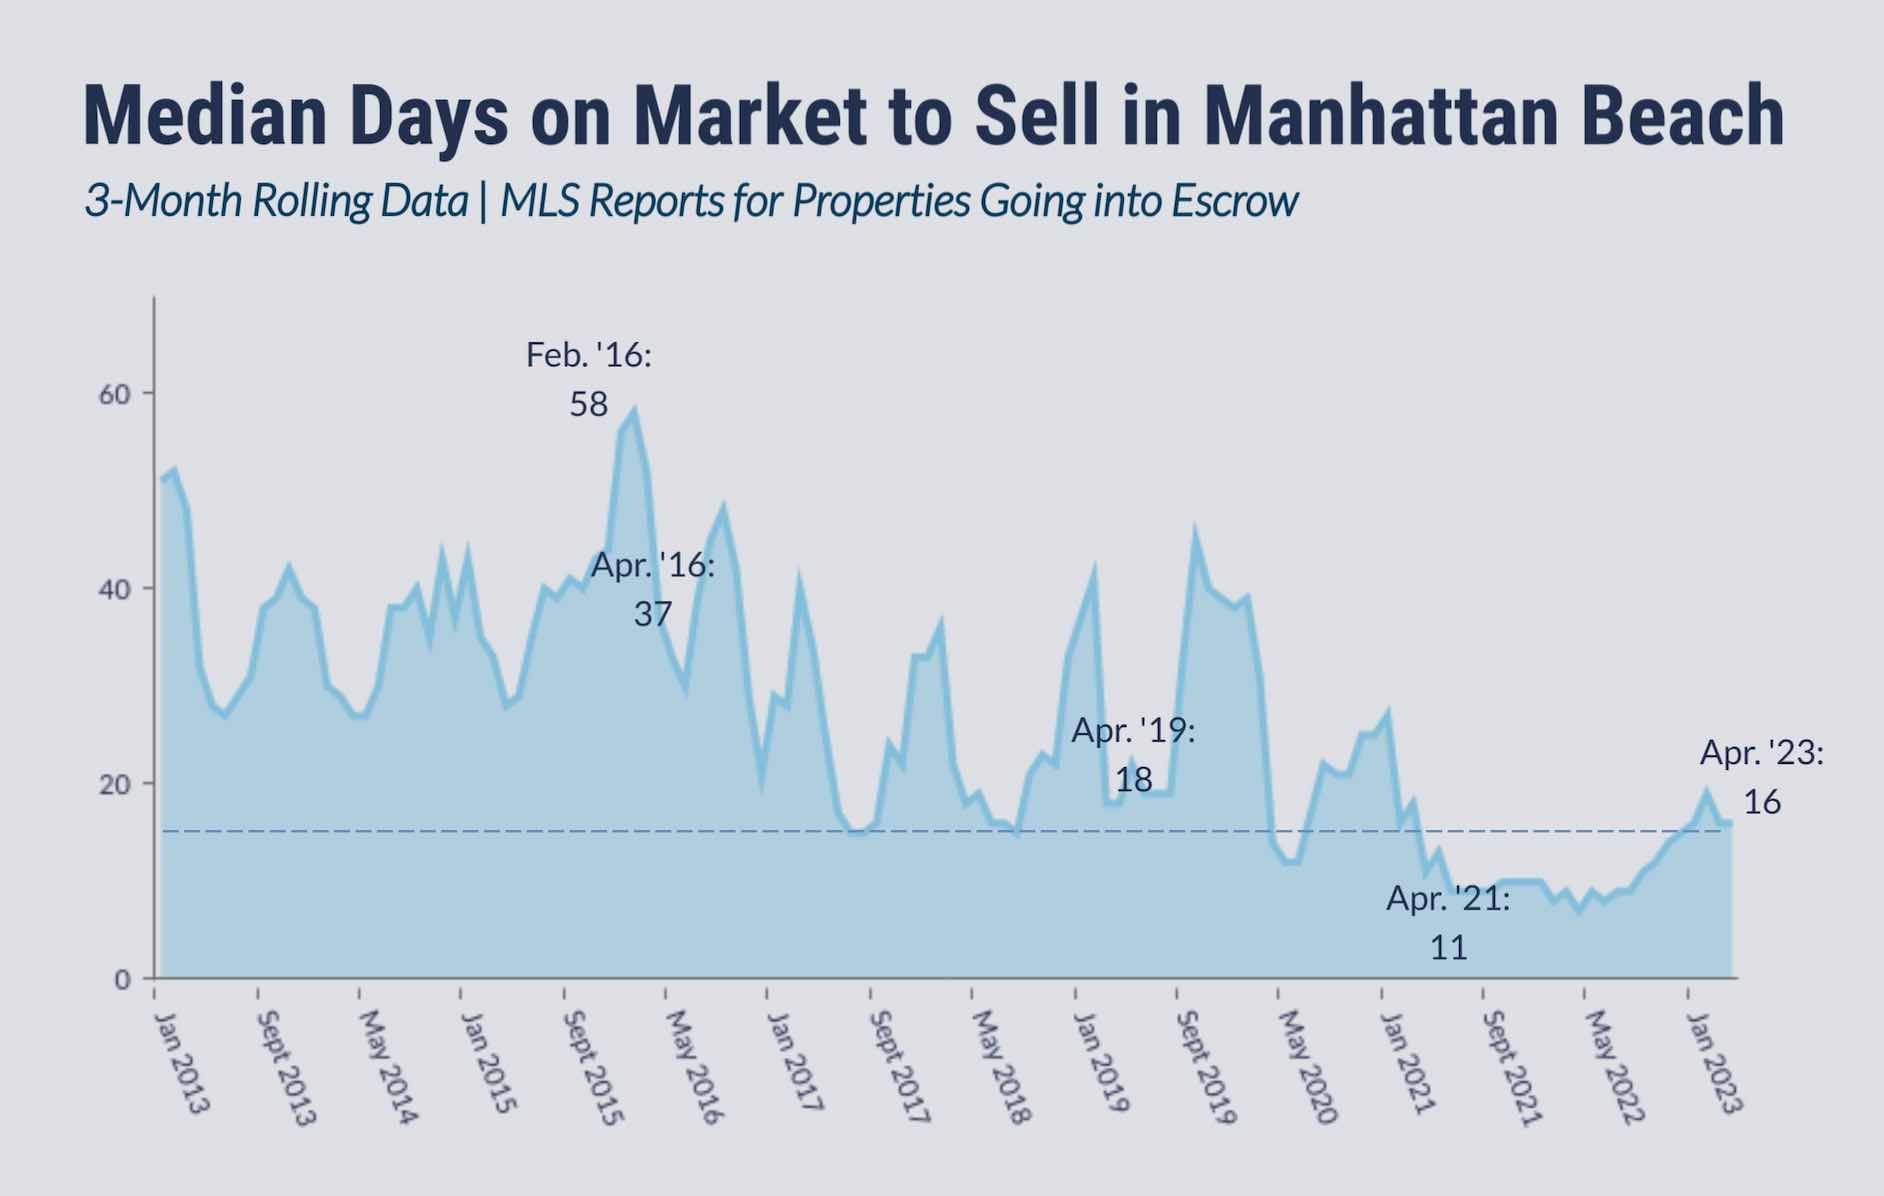
As you can see at the right edge of our chart, 16 days is more days on market than was typical for most of 2021-22, an extraordinarily hot time in the market. (Can we say "historically hot time?")
However, follow that little dotted line to the left. This shows you that a median of 16 DOM to sell is lower than almost all figures in the prior 10 years. It was bettered, only briefly, at a couple of points in 2017 and 2018.
Let's be clear on what we're measuring. We look only at MLS-listed properties, and only those that did make a deal. We take the median value for days on market, meaning half of the listings that sold required more than 16 days to ink a contract, and half needed fewer days. Also, we're smoothing out the data by using a rolling 3-month average.
As this Spring has picked up in pace, we've reflected several times on the advice we were giving at the earliest parts of this year. The market had just had several rough months, and there was a chance of continued price softness or declines into Spring/Summer. Days on market were rising.
That was good advice, based on the best data at the time, but trends have reversed.
Also, a little more inventory would help. Over the first half of May, new deals matched the number of new listings, with inventory remaining flat.
------------------------------------------------------
Here's the rest of our local real estate market update report for the period ending 5/15/23:
> 58 active listings as of 5/15/23 (flat from 4/30/23)
> 47 SFRs (flat)
> 11 THs (flat)
See the Inventory list as of 5/15/23 here, or see the MB Dashboard for up-to-the-minute data.
Active listings by region of Manhattan Beach in this report:
> Tree Section: 10 actives (flat)
> Sand Section: 25 actives (flat)
> Hill Section: 11 actives (flat)
> East MB: 12 actives (flat)
We're also providing a report on closed sales by region of MB.
Sales data, including PPSF for all properties, are organized by sub-region of Manhattan Beach.
Here's a link to the spreadsheet: "MB Pending/Sold as of 5/15/23".
Please see our blog disclaimer.
Listings presented above are supplied via the MLS and are brokered by a variety of agents and firms, not Dave Fratello or Edge Real Estate Agency, unless so stated with the listing. Images and links to properties above lead to a full MLS display of information, including home details, lot size, all photos, and listing broker and agent information and contact information.

