The local housing market is strong, in its way, with prices holding steady and most listings selling relatively quickly. (We've reported frequently on how prices have solidified.)
But low inventory has led to a crash in real estate sales totals.
The first half of 2023 saw fewer homes sold in Manhattan Beach than in the first year of COVID-19, a period which saw the near-complete shutdown of the market for weeks.
And the first half of 2023, with 117 closed sales in total, can't even hold a candle to the recession/housing crash years of 2008 or 2009, each of which saw more than 150 sales in the same period.
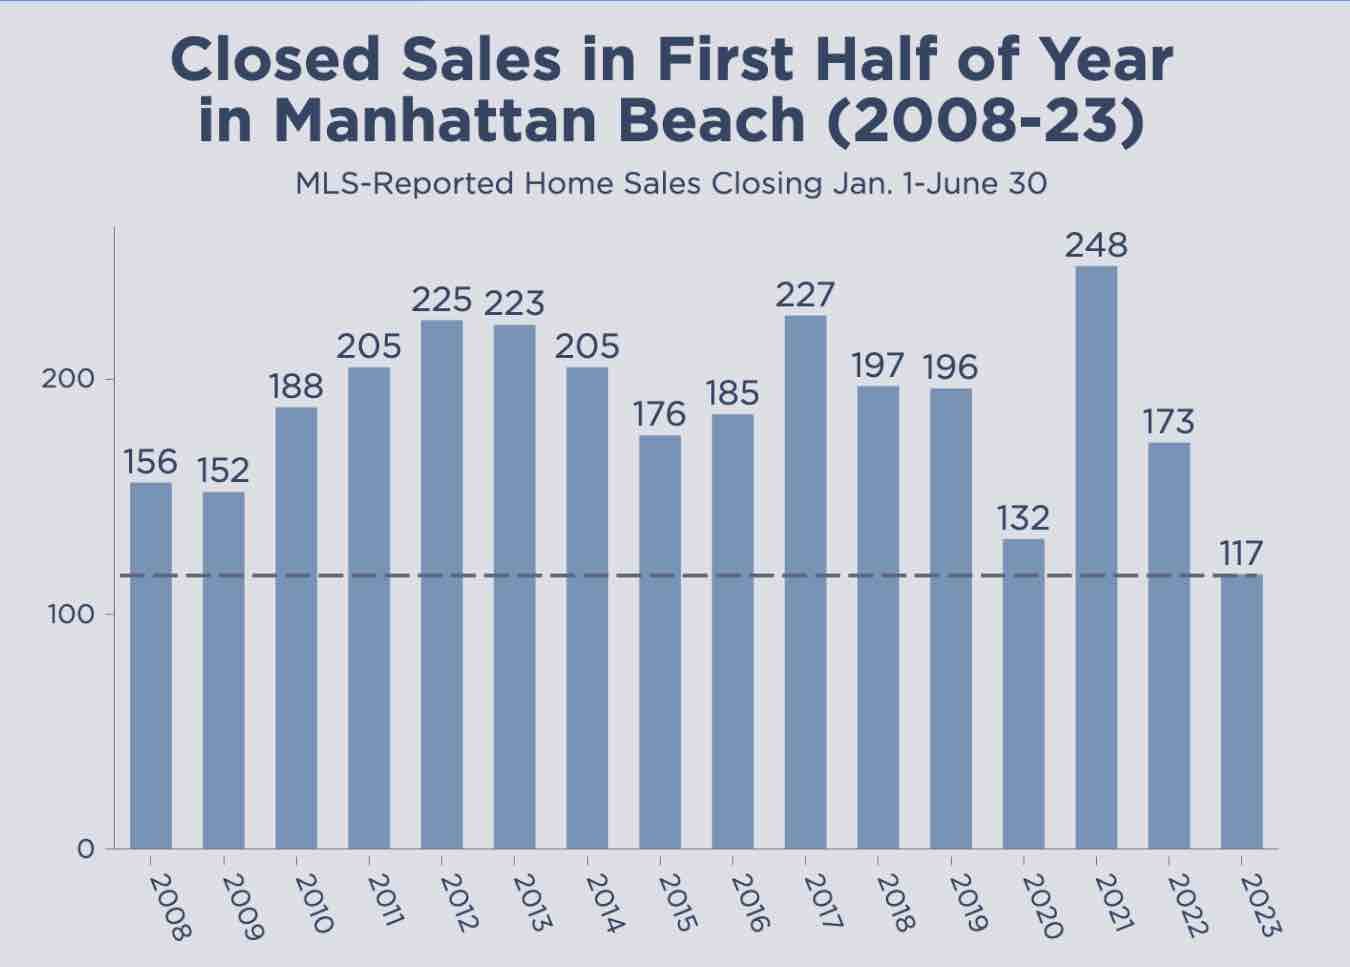
This means 2023 was the worst year, by a lot, out of the last 16.
As you can see in our chart, the far-and-away leader in first-half sales is 2021, with 248 sales in the same period – well over double the number of sales that happened this year.
Obviously, 2021 had some unique dynamics that generated a tsunami of real estate activity locally. Ultra-low interest rates, covid-inspired remote-work options and limitations on travel got lots of people chasing Manhattan Beach real estate.
They were lucky that there were enough willing sellers!
Since that incredible 2021 peak, the total number of sales in the first half has dropped more than 30% year-over-year in each of the past two years.
You just don't see 30% year-over-year drops in sales in prior years other than 2020, which (due to the aforementioned weeks-long shutdown) dropped 33% year-over-year from 2019's first half. The biggest year-over-year drop other than that was 14% between 2014 and 2015.
Yes, these last 4 years, 2020-23, have had some unusual factors. So we decided to compare each year's sales to the average for the whole set of 16 years, 2008-23.
Once again, 2023 looks uniquely horrible.
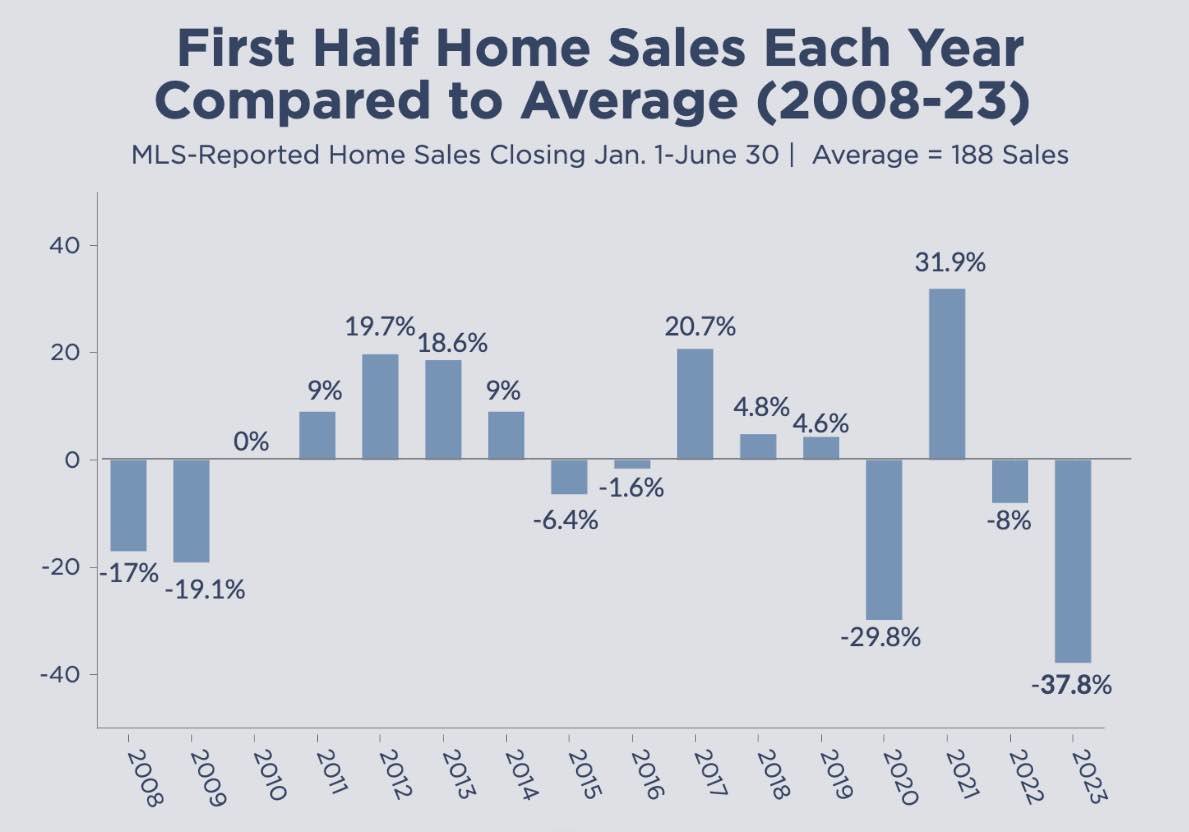
The average number of sales in the first half of the year from 2008-2023 was 188 sales.
The mere 117 sales this year was 37.8% below average.
That's a deeper drop against average than was seen in covid's debut in 2020, and – gulp! – almost double the deepest drop, 19.1% in the housing-crash year of 2009.
We're twice as bad as 2009?
We have sort of joked before, "if you're a real estate statistic, you don't want to be compared to 2009."
Good golly, if that's true, you certainly don't want to be twice as bad as a 2009 stat. Yeesh.
Worth noting: Last year's 8% slump below average was actually the worst performance since 2009 in a year that didn't have a brand-new global pandemic. That seemed bad, but who knew what was to come?
Looking at the bigger numbers above the zero line, you see how extraordinary 2021's jump was, nearly 32% above the average number of sales. Three rockin' prior years (2012, 2013, 2017) had seen sales of about 20% above average.
As to the slower numbers these past 2 years, we all know that things are tough all over.
Just about every real estate market is reporting back similar data this year. There is a sales slowdown triggered by an inventory slowdown. People aren't choosing to sell at anything like the normal pace, so buyers have fewer options. And sure, mortgage rates – which seem moderate historically, but are double recent rates – have frozen out some buyers.
We broadened our lens to look at a wider set of stats. Unfortunately, Manhattan Beach suffers by comparison to other markets.
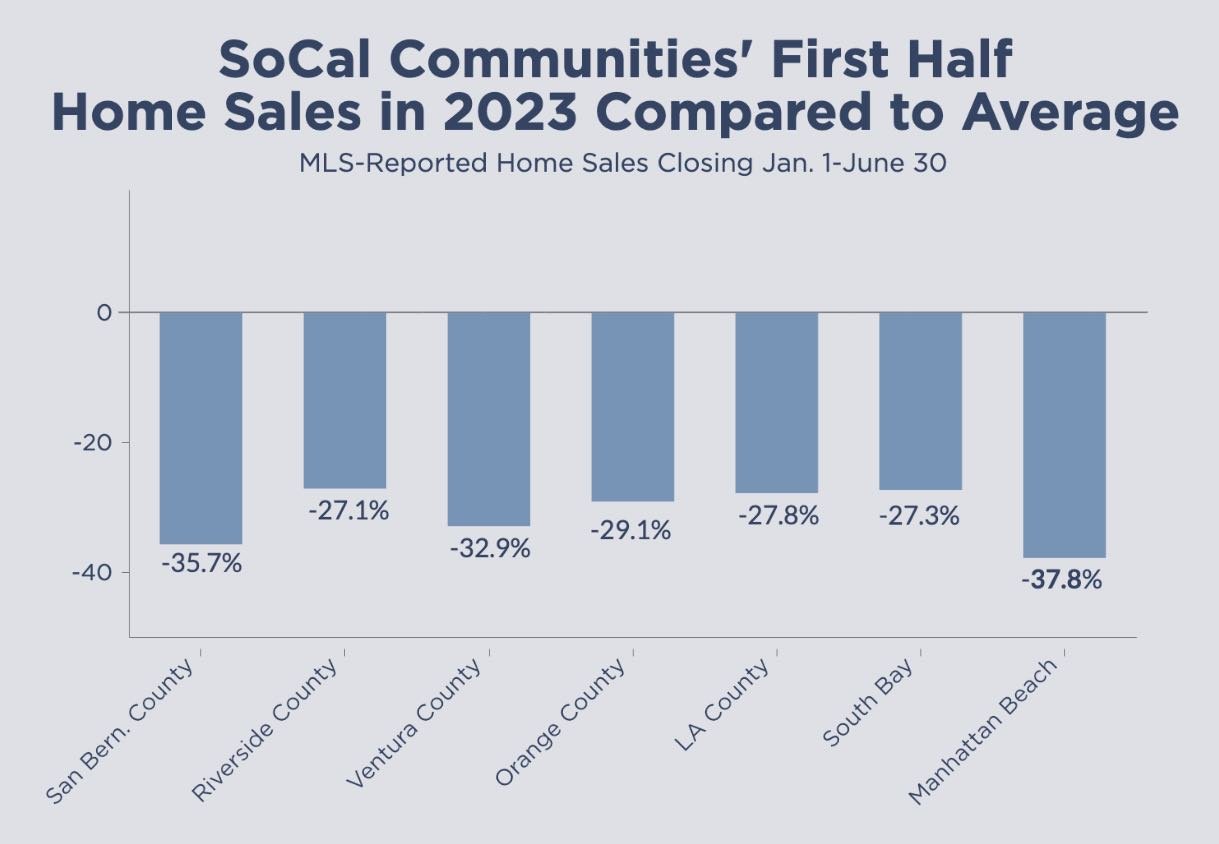
Start out over on the right edge of our chart, and you see quickly that Manhattan Beach, at 37.8% below average, was the worst-off of the markets we researched.
In fact, Manhattan Beach was 10% worse off than the South Bay generally and Los Angeles County as a whole.
When we broadened out further to look at the whole counties of Orange, Ventura, Riverside and San Bernardino, Manhattan Beach was suffering worse than all of them, with only San Bernardino County sorta close at -35.7% below average.
We'll be returning to those regional statistics in a future post, as we see it all as pretty big news.
For Manhattan Beach, specifically, it seems clear that the "excess" sales activity of (mostly) 2021 was almost, figuratively, "borrowed" from the future, meaning right now. The wild wobble in 4 years' worth of market stats all traces back to COVID-19 and near-zero mortgage rates that came out of efforts to prevent economic collapse.
The economy's fine. Local real estate sales... not so much.
------------------------------------------------------
Here's the rest of our local real estate market update report for the period ending 6/30/23:
> 57 active listings as of 6/30/23 (+2 from 6/15/23)
> 45 SFRs (+1)
> 12 THs (+1)
See the Inventory list as of 6/30/23 here, or see the MB Dashboard for up-to-the-minute data.
Active listings by region of Manhattan Beach in this report:
> Tree Section: 12 actives (+2)
> Sand Section: 22 actives (+1)
> Hill Section: 10 actives (-1)
> East MB: 13 actives (flat)
We're also providing a report on closed sales by region of MB.
Sales data, including PPSF for all properties, are organized by sub-region of Manhattan Beach.
Here's a link to the spreadsheet: "MB Pending/Sold as of 6/30/23".
-------------------------------------------------------------------------------------------
Nerdy notes:
Chart data comes from the California Regional Multiple Listing Service, Inc., InfoSparks © 2023 ShowingTime.
All charts custom crafted by Dave Fratello for MB Confidential, and copyrighted.

