Something interesting happened while you were away in August.
It was quietly the biggest month for closed sales in Manhattan Beach all year.
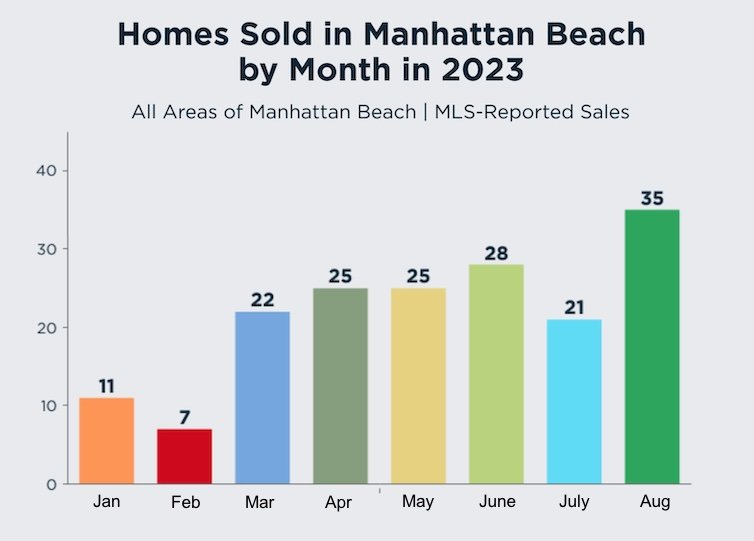
Now, 35 sales in a month isn't a huge number. Most recent Augusts have had more sales, or at least similar numbers.
But we're going to take the good news where we can get it.
The sizable number of sales in August came amid an ongoing inventory shortage, and after July's anemic 21 closed sales. (Keep in mind that sales closing in August generally would have gone into escrow in June or July.)
There was other news out of August that reflected some strength in the market: The median price bumped up again.
First, recall that by the end of July, the rolling 12-month median home price in Manhattan Beach had dropped to $2.800M, down from $3.100M in just a couple of months!
In our post reporting that steep drop, we took a look at pending sales at the time, and speculated that if they closed in August: "it looks like the median price citywide would bump up only to $2.900M."
Hey, guess what the new median price is? $2.900M.
(Stick with us if you like facts and details.)
Both of these data points are essentially good news for a market that has wobbled and has been hobbled for stretches of 2023.
It will appear to give a little momentum to the market as we enter the post-Labor Day market, traditionally the 2nd-busiest time of year for new listings and sales. (And for starters, the small rush of new inventory already is not disappointing.)
We should put the August numbers in context, twice over.
First, August couldn't rescue 2023 from having the fewest sales for any 3-month Summer stretch in recent years.
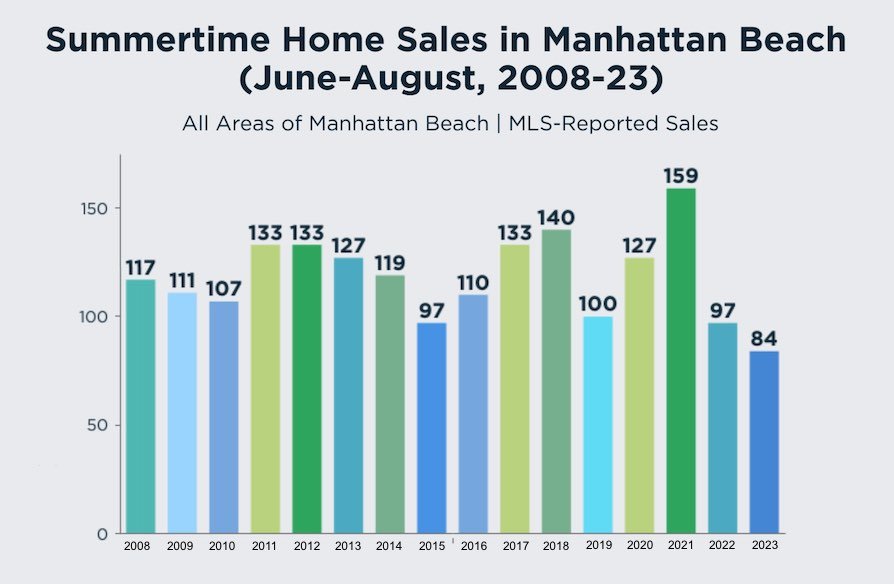
Very few Summers have seen less than 100 sales from June 1-Aug. 31, but this Summer came in with just 84 closings.
You can peek back at 2008-2010 to see three years we all know were tumultuous in the financial markets and hard for real estate, but you're going to see three Summers during those years that were all notably busier than this Summer here in 2023.
(And hey, yeah, 2021, we see you showing off with your 159 sales in Summer, nearly double this year's total. We get it, k?)
August's nicer totals also can't really put year-to-date sales on a regular track, either.
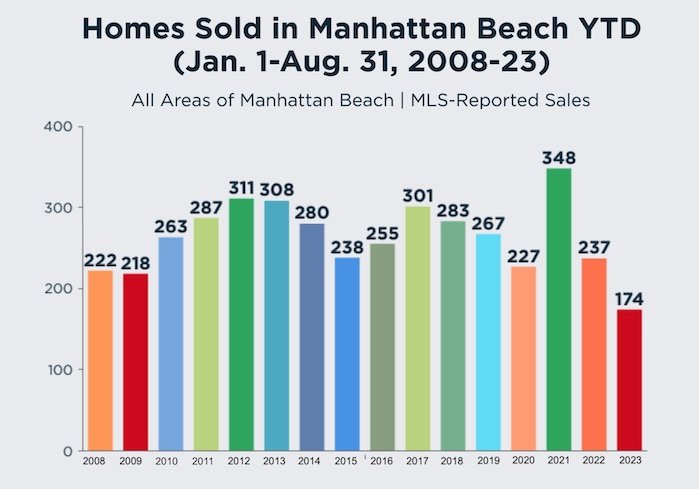
It's not a huge surprise to see that 2023 sales totals are underperforming against all recent years, but it's still a bit dramatic.
From Jan. 1-Aug. 31 this year, we had 174 closed sales in Manhattan Beach – precisely 50% of the number of sales for the same period of 2021.
Sales were 20% below the worst year of the prior 15, the recession-hammered 2009.
Economic conditions today are nothing like 2008-09, with ultra-low unemployment, inflation slowing toward normal, and markets humming along, more or less. (We'll grant that even views on economic conditions are becoming polarized these days, but we're trying to stick to basic facts.)
The story behind lower inventory and lower sales remains largely one about mortgage interest rates, and especially the significant rise in those rates since the 3%-and-below mortgage party of 2020-22. If you're looking at something more toward 7% today, affordability is tighter, and for potential sellers, there seems to be an added hurdle – leaving behind a great low rate.
Despite the challenges, this resilient real estate market seems to be trying to break out of its slumber.
Welcome to the Fall market.
------------------------------------------------------
Here's the rest of our local real estate market update report for the period ending 8/31/23:
> 60 active listings as of 8/31/23 (+7 from 8/15/23)
> 48 SFRs (+6)
> 12 THs (+1)
See the Inventory list as of 8/31/23 here, or see the MB Dashboard for up-to-the-minute data.
Active listings by region of Manhattan Beach in this report:
> Tree Section: 16 actives (+4)
> Sand Section: 25 actives (+4)
> Hill Section: 9 actives (-1)
> East MB: 10 actives (flat)
We're also providing a report on closed sales by region of MB.
Sales data, including PPSF for all properties, are organized by sub-region of Manhattan Beach.
Here's a link to the spreadsheet: "MB Pending/Sold as of 8/31/23".
Please see our blog disclaimer.
Listings presented above are supplied via the MLS and are brokered by a variety of agents and firms, not Dave Fratello or Edge Real Estate Agency, unless so stated with the listing. Images and links to properties above lead to a full MLS display of information, including home details, lot size, all photos, and listing broker and agent information and contact information.

