Local housing inventory continues its surprising autumn drop.
 Virtually all year long, Manhattan Beach has had more homes on the market than for any year during the current market rally.
No more.
Look at that bold blue line in our chart. After months of sailing above recent inventory highs, you can see…
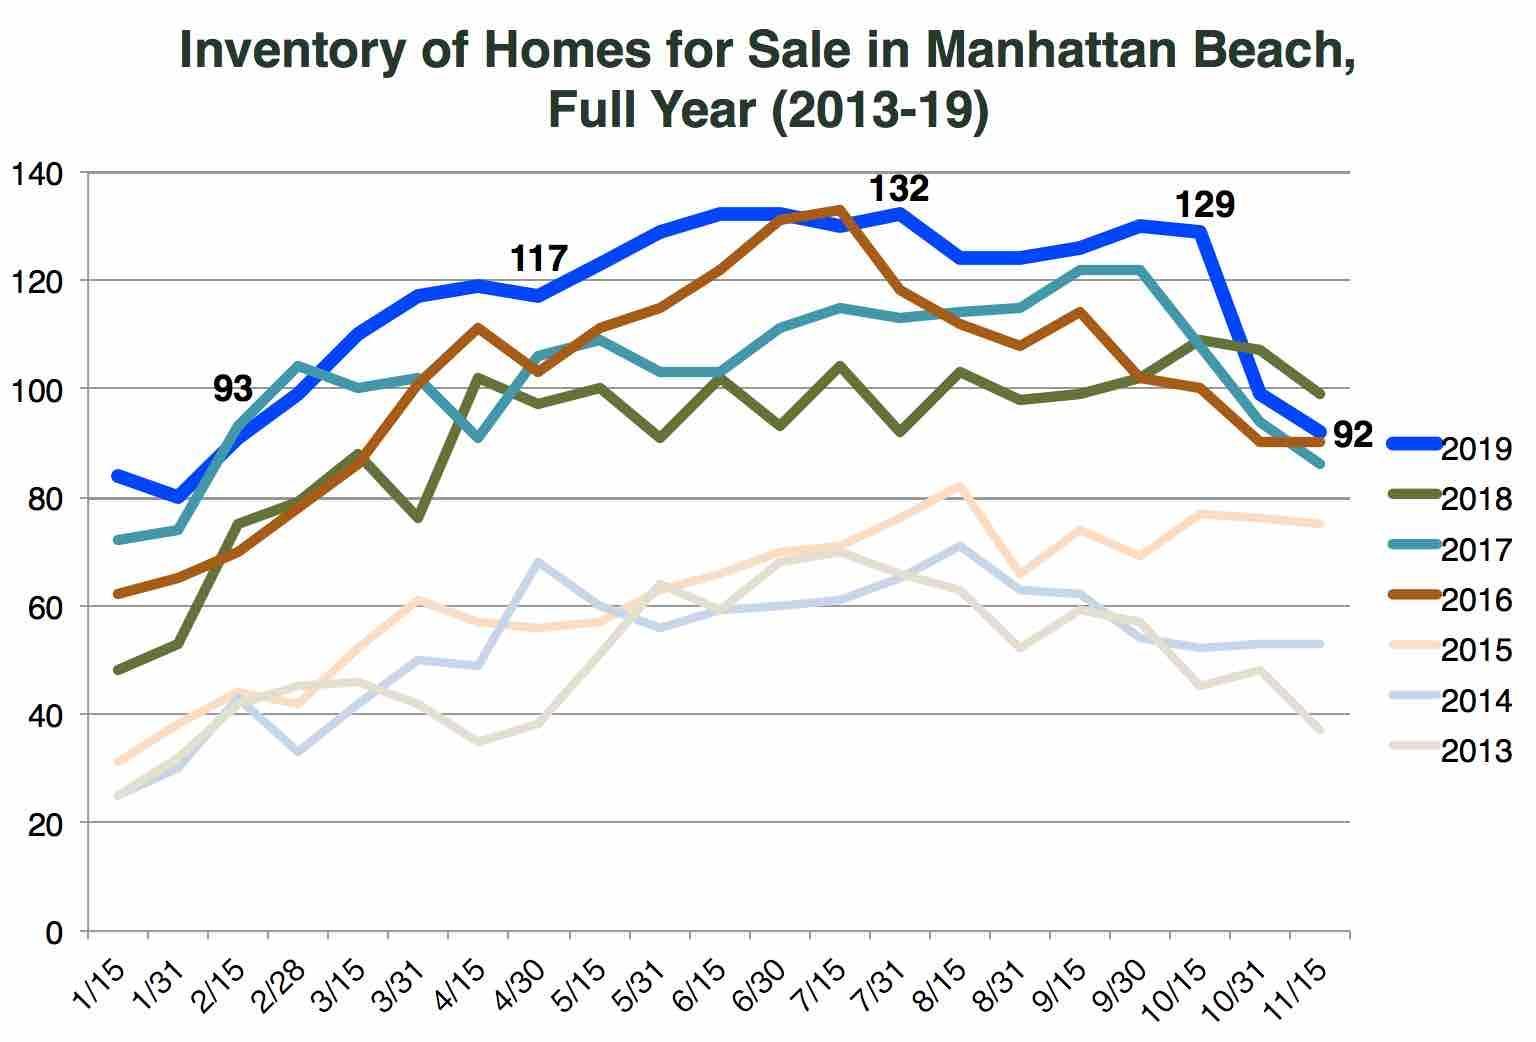
Local housing inventory continues its surprising autumn drop.
Virtually all year long, Manhattan Beach has had more homes on the market than for any year during the current market rally.
No more.
Look at that bold blue line in our chart. After months of sailing above recent inventory highs, you can see the sudden dive to 92 listings as of 11/15.
We haven't seen a level that low since mid-February, before the season got busy.
Where'd all the homes go?
A bunch have gone into escrow, as we documented here, recounting the "Rocktober" MB had just experienced.
And there's a seasonal trend now. As you can see in the chart, in most years, as the holiday season approaches, fewer homes are on the market. That's sellers taking their unsold homes off for a while, to enjoy the season and to avoid accruing extra DOM at a time when they're less likely to sell.
For some reason, though, the mix of circumstances taking homes off the market is just faster than usual.
We can still watch the level of lingering holiday-season inventory. The level of 92 listings now is quite consistent with each of the prior 3 years.
Love Data?
You'll probably appreciate a first look at MBC's detailed data report on the first 3 quarters of real estate activity in Manhattan Beach.
We'll be promoting the report more soon, but you can see it right now here: Click to view the MB report.
It's our most ambitious such report ever. It's free.
If you're not yet registered on MB Confidential, you'll just need to supply basic registration info. If you're already a member, you'll just need to tick a box to access the report.
Here's the rest of our local real estate market update report for the period ending 11/15/19:
- 92 active listings as of 11/15/19 (-7 from 10/31/19)
- 73 SFRs (-1)
- 19 THs (-6)
See the Inventory list as of 11/15/19 here, or see the MB Dashboard for up-to-the-minute data.
Active listings by region of Manhattan Beach in this report:
- Tree Section: 19 actives (+1)
- Sand Section: 43 actives (-3)
- Hill Section:8 actives (-3)
- East MB: 22 (-1)
We're also providing a report on closed sales by region of MB.
Sales data, including PPSF for all properties, are organized by sub-region of Manhattan Beach.
Here's a link to the spreadsheet: "MB Pending/Sold as of 11/15/19.
Please see our blog disclaimer.
Listings presented above are supplied via the MLS and are brokered by a variety of agents and firms, not Dave Fratello or Edge Real Estate Agency, unless so stated with the listing. Images and links to properties above lead to a full MLS display of information, including home details, lot size, all photos, and listing broker and agent information and contact information.
Based on information from California Regional Multiple Listing Service, Inc. as of April 28th, 2024 at 4:10pm PDT. This information is for your personal, non-commercial use and may not be used for any purpose other than to identify prospective properties you may be interested in purchasing. Display of MLS data is usually deemed reliable but is NOT guaranteed accurate by the MLS. Buyers are responsible for verifying the accuracy of all information and should investigate the data themselves or retain appropriate professionals. Information from sources other than the Listing Agent may have been included in the MLS data. Unless otherwise specified in writing, Broker/Agent has not and will not verify any information obtained from other sources. The Broker/Agent providing the information contained herein may or may not have been the Listing and/or Selling Agent.


