If you recall in any way the slumpy 4th quarter of 2018, you have to be encouraged by the statistics coming out of Q4 2019.
The Manhattan Beach real estate market was on fire in October, with a huge run of new escrows. (We've called it "Rocktober" a couple of times.)
 Now we've looked at numbers for November,…
If you recall in any way the slumpy 4th quarter of 2018, you have to be encouraged by the statistics coming out of Q4 2019.
The Manhattan Beach real estate market was on fire in October, with a huge run of new escrows. (We've called it "Rocktober" a couple of times.)
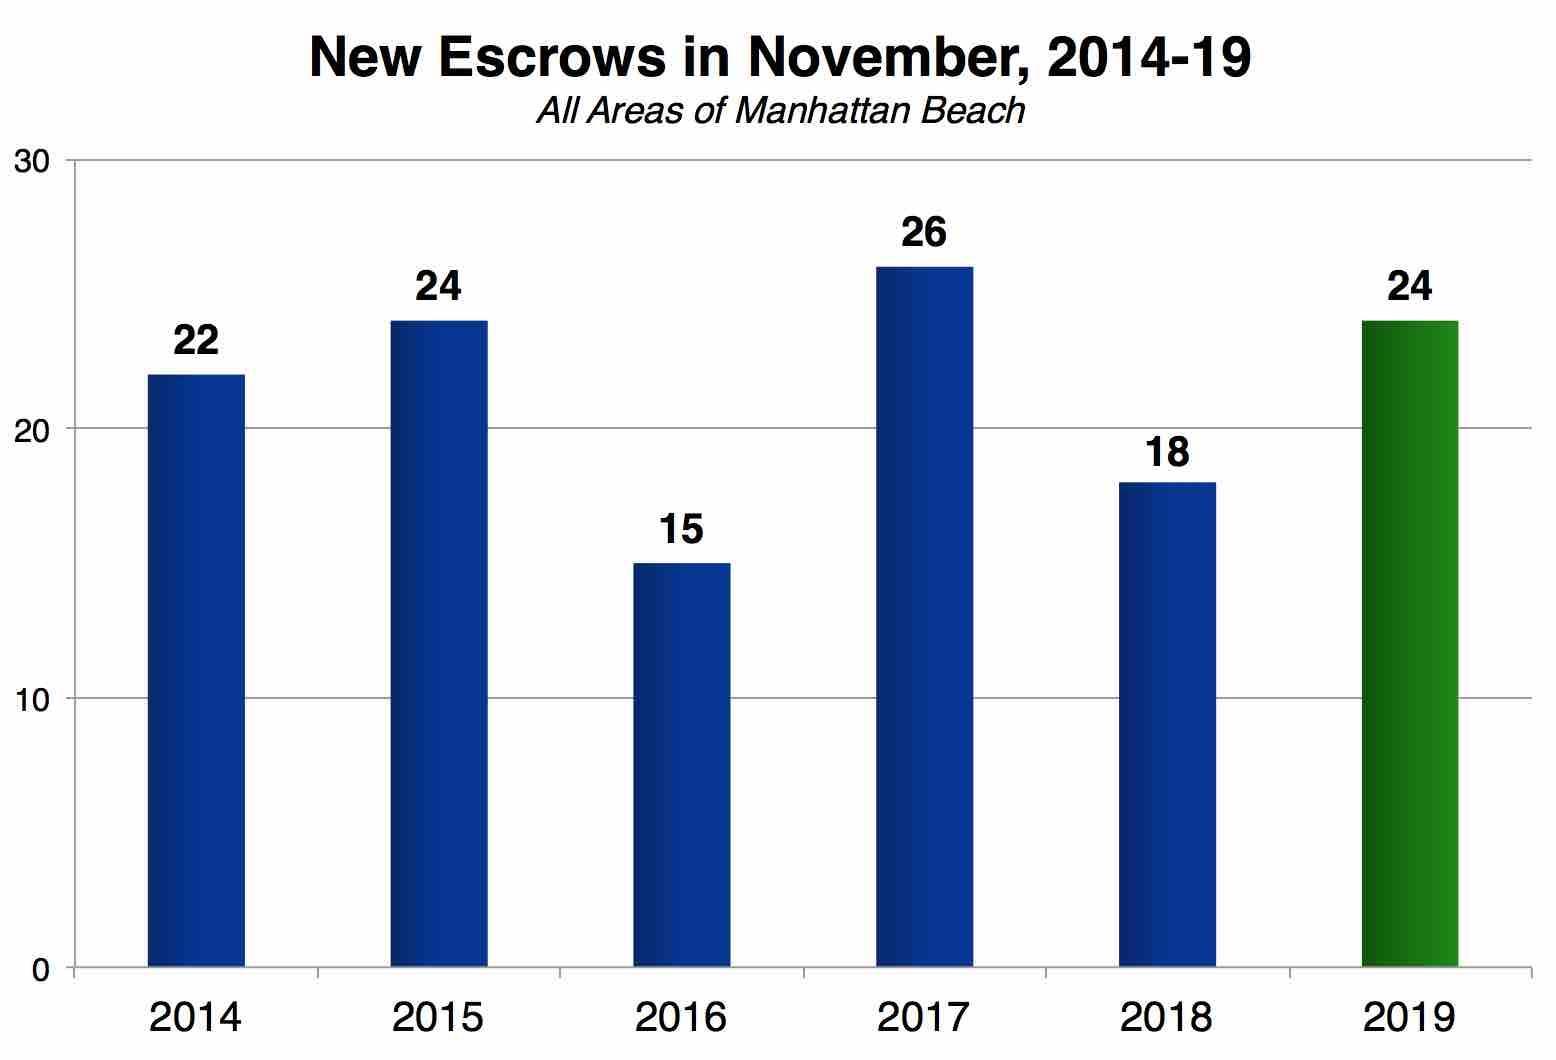
Now we've looked at numbers for November, and we can say both that November 2019 was pretty normal, and definitely that it was better than the same month last year.
With 24 homes newly going into escrow, we were up by 6 from 2018's iffy November, up 9 from the doldrums of 2016's November, and relatively on par with 2014, '15 and '17.
Brief nerdy note: This data set was drawn from our twice-monthly MB Market Updates, whereas the equivalent chart for October 2019 was drawn from an MLS data dump.
Meantime, a brief update on sales totals for the past year.
We revealed in our new MB Market Report that the running 12-month total of sales had dipped by Sept. 30, 2019, to just 372 sales. This was the slowest 12-month period for 3 years, dating to Summer 2016.
By the end of November, we had 377 sales in the prior 12 months, a slight improvement on the pace, still pretty much equal to wobbly late 2016.
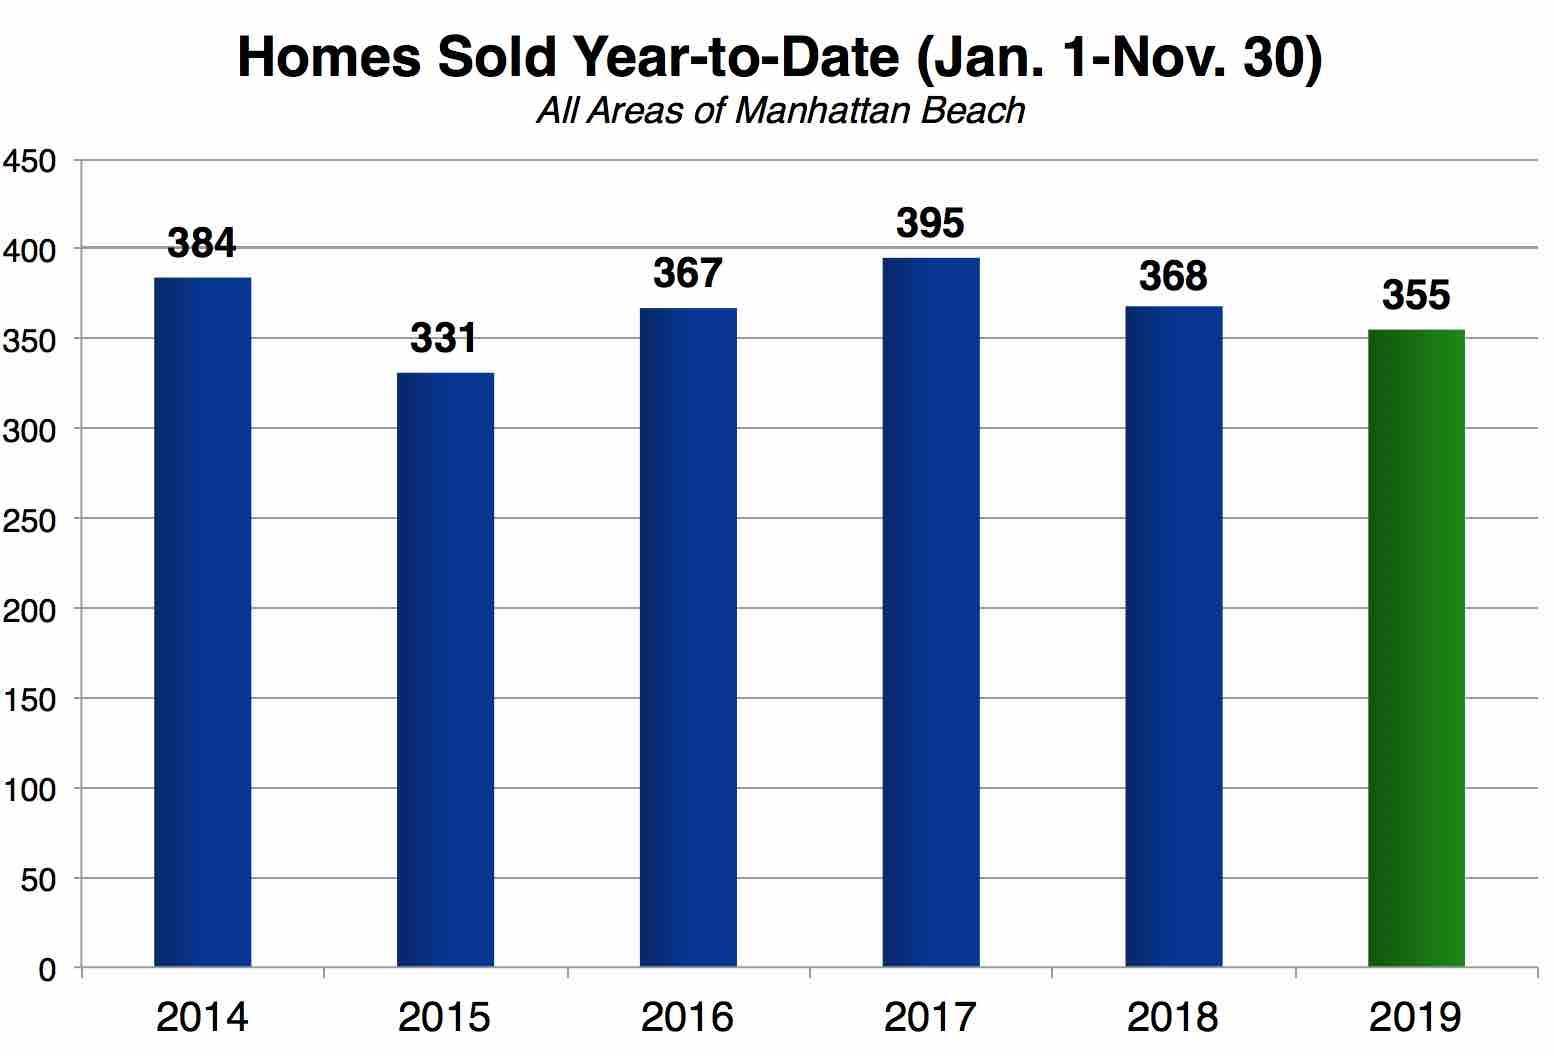 Looking at YTD figures, meaning 11 months' worth of sales only, within each calendar year, you will see much of the same story.
Sales totals for this year are behind each of the recent years except 2015.
Yes, it's hard to remember, but there was quite a lull at that time, after a few years of a rocketing market. But everything rebounded nicely after that.
On a positive note, inventory, at 79 listings at last month's end, is down from 90 at the same time last year.
Here's the rest of our local real estate market update report for the period ending 11/30/19:
- 79 active listings as of 11/30/19 (-13 from 11/15/19)
- 63 SFRs (-10)
- 16 THs (-3)
See the Inventory list as of 11/30/19 here, or see the MB Dashboard for up-to-the-minute data.
Active listings by region of Manhattan Beach in this report:
- Tree Section: 20 actives (+1)
- Sand Section: 38 actives (-5)
- Hill Section: 7 actives (-1)
- East MB: 14 (-8)
We're also providing a report on closed sales by region of MB.
Sales data, including PPSF for all properties, are organized by sub-region of Manhattan Beach.
Here's a link to the spreadsheet: "MB Pending/Sold as of 11/30/19".
Please see our blog disclaimer.
Listings presented above are supplied via the MLS and are brokered by a variety of agents and firms, not Dave Fratello or Edge Real Estate Agency, unless so stated with the listing. Images and links to properties above lead to a full MLS display of information, including home details, lot size, all photos, and listing broker and agent information and contact information.
Based on information from California Regional Multiple Listing Service, Inc. as of April 29th, 2024 at 4:55am PDT. This information is for your personal, non-commercial use and may not be used for any purpose other than to identify prospective properties you may be interested in purchasing. Display of MLS data is usually deemed reliable but is NOT guaranteed accurate by the MLS. Buyers are responsible for verifying the accuracy of all information and should investigate the data themselves or retain appropriate professionals. Information from sources other than the Listing Agent may have been included in the MLS data. Unless otherwise specified in writing, Broker/Agent has not and will not verify any information obtained from other sources. The Broker/Agent providing the information contained herein may or may not have been the Listing and/or Selling Agent.


