Welcome back. While you were (hopefully) gone, you missed a little bit of real estate activity in MB, and a lot of quiet.
 No question, the biggest sale in this market update period was 703 Bayview (4br/5ba, 2950 sqft.), the second huuuuuuuge closing of a new Sand Section townhome in the space of 2-3 weeks.
…
Welcome back. While you were (hopefully) gone, you missed a little bit of real estate activity in MB, and a lot of quiet.
No question, the biggest sale in this market update period was 703 Bayview (4br/5ba, 2950 sqft.), the second huuuuuuuge closing of a new Sand Section townhome in the space of 2-3 weeks.
703 Bayview netted $5.575M (call it 5.6), not long after ultramodern 100 Manhattan Ave. (3br/4ba, 2600 sqft.) got $4.900M. These numbers are in rare air indeed. It would seem they're pointing the way to an even higher-priced world, south of the pier especially, for new construction in particular.
The sale also produced a winner for our "Bet the House #3" contest. The entry with the best combination of forecasts for final sale price, days on market and number of price cuts will be notified soon and that person wins a $50 gift card to local restaurants.
Big sales by the beach aren't the only story.
There's also a big question: What's going on with inventory in the Sand Section?
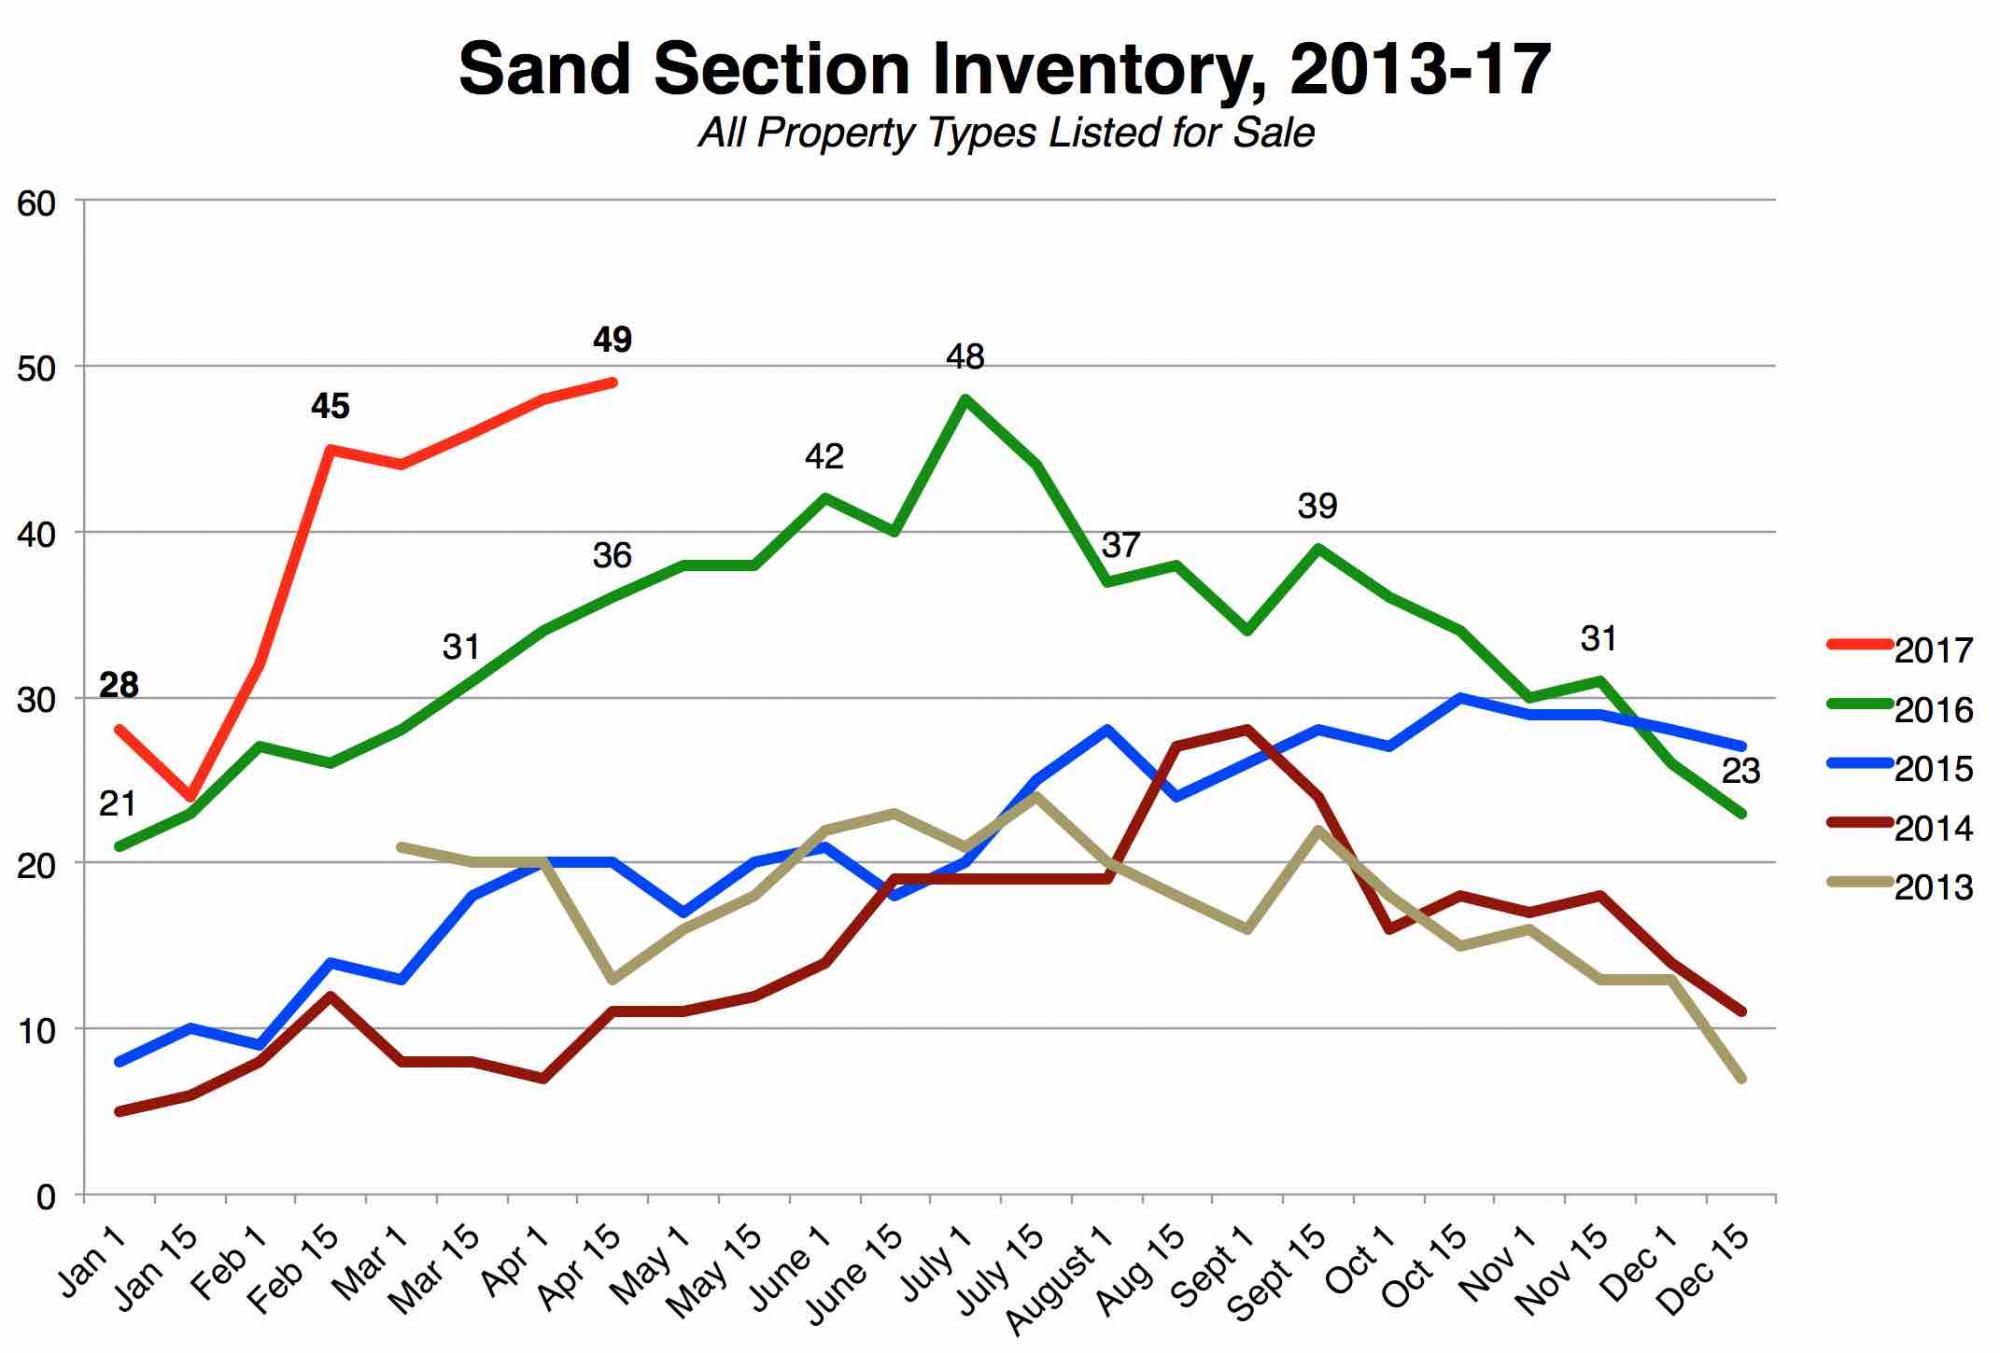 There were 49 homes for sale in the Sand as of Easter weekend, the highest number we've recorded here in data going back to 2013. (It's at 51 on Weds. afternoon.)
Sand Section inventory often hovers in the 20s somewhere, last year was mostly in the 30s and hit a one-time blip of a peak of 48 in July 2016.
As you see from our chart, Sand Section inventory shot up in late January-early February, and hasn't settled down. It's a big bump over the prior 4 years.
This overhang of inventory by the beach is occurring at a time when there were notably fewer listings, due to absorption (sales), in all other parts of town. For instance, the Tree Section was down by 8 to just 12 (twelve!) in mid-April, compared to 2 weeks earlier.
Last year, the Trees had 32 listings (2.5 times today's total) at the mid-April report. (That's when people were saying, "What's wrong in the Tree Section? Are there no buyers?")
Curiously, there are more public-market closed sales in the Sand Section to date (25) than there were last year (20). (Jan. 1-April 15 of each year.)
And there are more homes now in escrow in the Sand Section (15) than there were at the same time last year (13).
Dave's closed 2 sales in the Sand so far this year, one on-market (815 Crest) and one off-market, and we've got one listing in escrow (309 20th), one not. It certainly seems that there are buyers out there, but there are just more sellers today.
Here's the rest of our local real estate market update report for the period ending 4/15/17:
- 91 active listings as of 4/15/17 (-11 from 4/3/17)
- 78 SFRs (-12)
- 13 THs (+1)
See the inventory list as of 4/15/17 here, or see the MB Dashboard for up-to-the-minute data.
Active listings by region of Manhattan Beach in this report:
- Tree Section: 12 actives (-8)
- Sand Section: 49 actives (+1)
- Hill Section: 11 actives (-2)
- East MB: 19 actives (-2)
We're also providing a report on closed sales by region of MB.
Sales data, including PPSF for all properties, are organized by sub-region of Manhattan Beach.
Here's a link to the spreadsheet: "MB Pending/Sold as of 4/15/17."
--------------------------------------------------------------------
Want to stay up to date on all local market activity?
Get the Ticker delivered to your inbox daily. Click below.

Please see our blog disclaimer.
Listings presented above are supplied via the MLS and are brokered by a variety of agents and firms, not Dave Fratello or Edge Real Estate Agency, unless so stated with the listing. Images and links to properties above lead to a full MLS display of information, including home details, lot size, all photos, and listing broker and agent information and contact information.


