
With 2016 now fully in the rear-view mirror, we'll start taking a look at the notable data and trends from the year that was.
That starts here with our regular twice-monthly market update.
As we reached year end, inventory continued its expected seasonal drop, hitting a "low" of 70 on the last day of…
With 2016 now fully in the rear-view mirror, we'll start taking a look at the notable data and trends from the year that was.
That starts here with our regular twice-monthly market update.
As we reached year end, inventory continued its expected seasonal drop, hitting a "low" of 70 on the last day of 2016.
That's 32% higher than the 53 active listings seen in Manhattan Beach at the end of 2015, and more than double the totals for 2013-14. (See our latest inventory analysis here: "MB Inventory by Area, 2013-16.")
Remember, though, the median price for MB was still rising when we looked at the end of Q3, despite a year-long rise in inventory over previous years. We'll run the numbers for all of 2016 soon. (See from October: "Would You Believe Prices Are Up?")
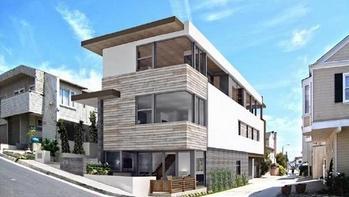 The last house to sell in 2016?
According to the MLS data we are using here, it's 216 28th – new construction in the Sand Section near Bruce's Beach, commanding a king's ransom (list: $7.495M).
Dave had some negotiations going on before and after the ball dropped in Times Square, with one new deal resulting off-market. More on that when we can discuss freely.
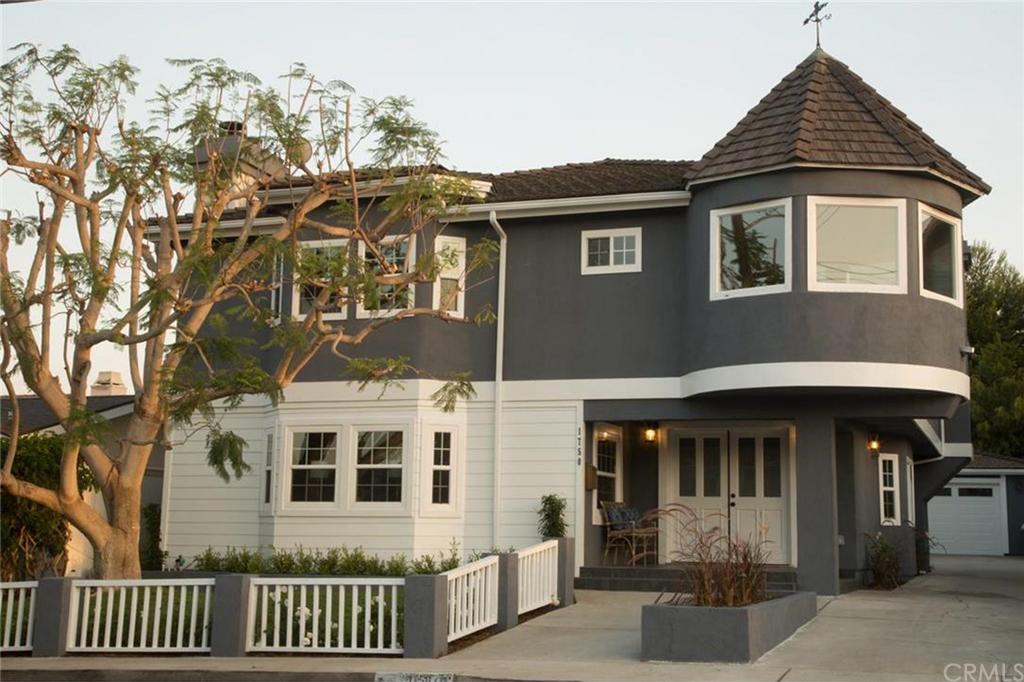 The last actual closed sale of 2016 was a flipper remodel at 1750 1st St. (5br/3ba, 3130 sqft.).
They took a tired Tudor and turned it into something pretty nice. It took a couple of escrows and some price cuts, but it worked out in the end.
Acquisition: $1.750M.
Sale: $2.250M.
Flipper: Happy.
The last actual new listing to hit the MLS before year end was a corner-lot duplex at 316 32nd, which might sell for land value. The start price there is $2.995M.
That's just a first look at some of the data for the year.
Here's the rest of our local real estate market update report for the period ending 12/31/16:
- 70 active listings as of 12/31/16 (-8 from 12/15/16)
- 62 SFRs (-5)
- 8 THs (-3)
See the inventory list as of 12/31/16 here, or see the MB Dashboard for up-to-the-minute data.
Active listings by region of Manhattan Beach in this report:
- Tree Section: 18 actives (-4)
- Sand Section: 28 actives (+5)
- Hill Section: 10 actives (same)
- East MB: 16 actives (-7)
We're also providing a report on closed sales by region of MB.
Sales data, including PPSF for all properties, are organized by sub-region of Manhattan Beach.
Here's a link to the spreadsheet: "MB Pending/Sold as of 12/31/16."
Please see our blog disclaimer.
Listings presented above are supplied via the MLS and are brokered by a variety of agents and firms, not Dave Fratello or Edge Real Estate Agency, unless so stated with the listing. Images and links to properties above lead to a full MLS display of information, including home details, lot size, all photos, and listing broker and agent information and contact information.
Based on information from California Regional Multiple Listing Service, Inc. as of April 29th, 2024 at 6:15am PDT. This information is for your personal, non-commercial use and may not be used for any purpose other than to identify prospective properties you may be interested in purchasing. Display of MLS data is usually deemed reliable but is NOT guaranteed accurate by the MLS. Buyers are responsible for verifying the accuracy of all information and should investigate the data themselves or retain appropriate professionals. Information from sources other than the Listing Agent may have been included in the MLS data. Unless otherwise specified in writing, Broker/Agent has not and will not verify any information obtained from other sources. The Broker/Agent providing the information contained herein may or may not have been the Listing and/or Selling Agent.


