It's time for one of our regular updates on the Manhattan Beach real estate market.
Just as they've (finally) begun voting in the presidential election now, we're also now getting to the time in the real estate calendar where predictions can be put to the test, and we can finally find out what kind of a year…
It's time for one of our regular updates on the Manhattan Beach real estate market.
Just as they've (finally) begun voting in the presidential election now, we're also now getting to the time in the real estate calendar where predictions can be put to the test, and we can finally find out what kind of a year this will be.
Is this another rally year for Manhattan Beach real estate? A time to see the market calm, but not wobble? The end of a 5-year party?
 The Super Bowl is the traditional kickoff to the "Spring" real estate season. So this is when there should be more activity. As we begin, there's no obvious worry in the market today.
Inventory poses an interesting question. It's up. What might that mean?
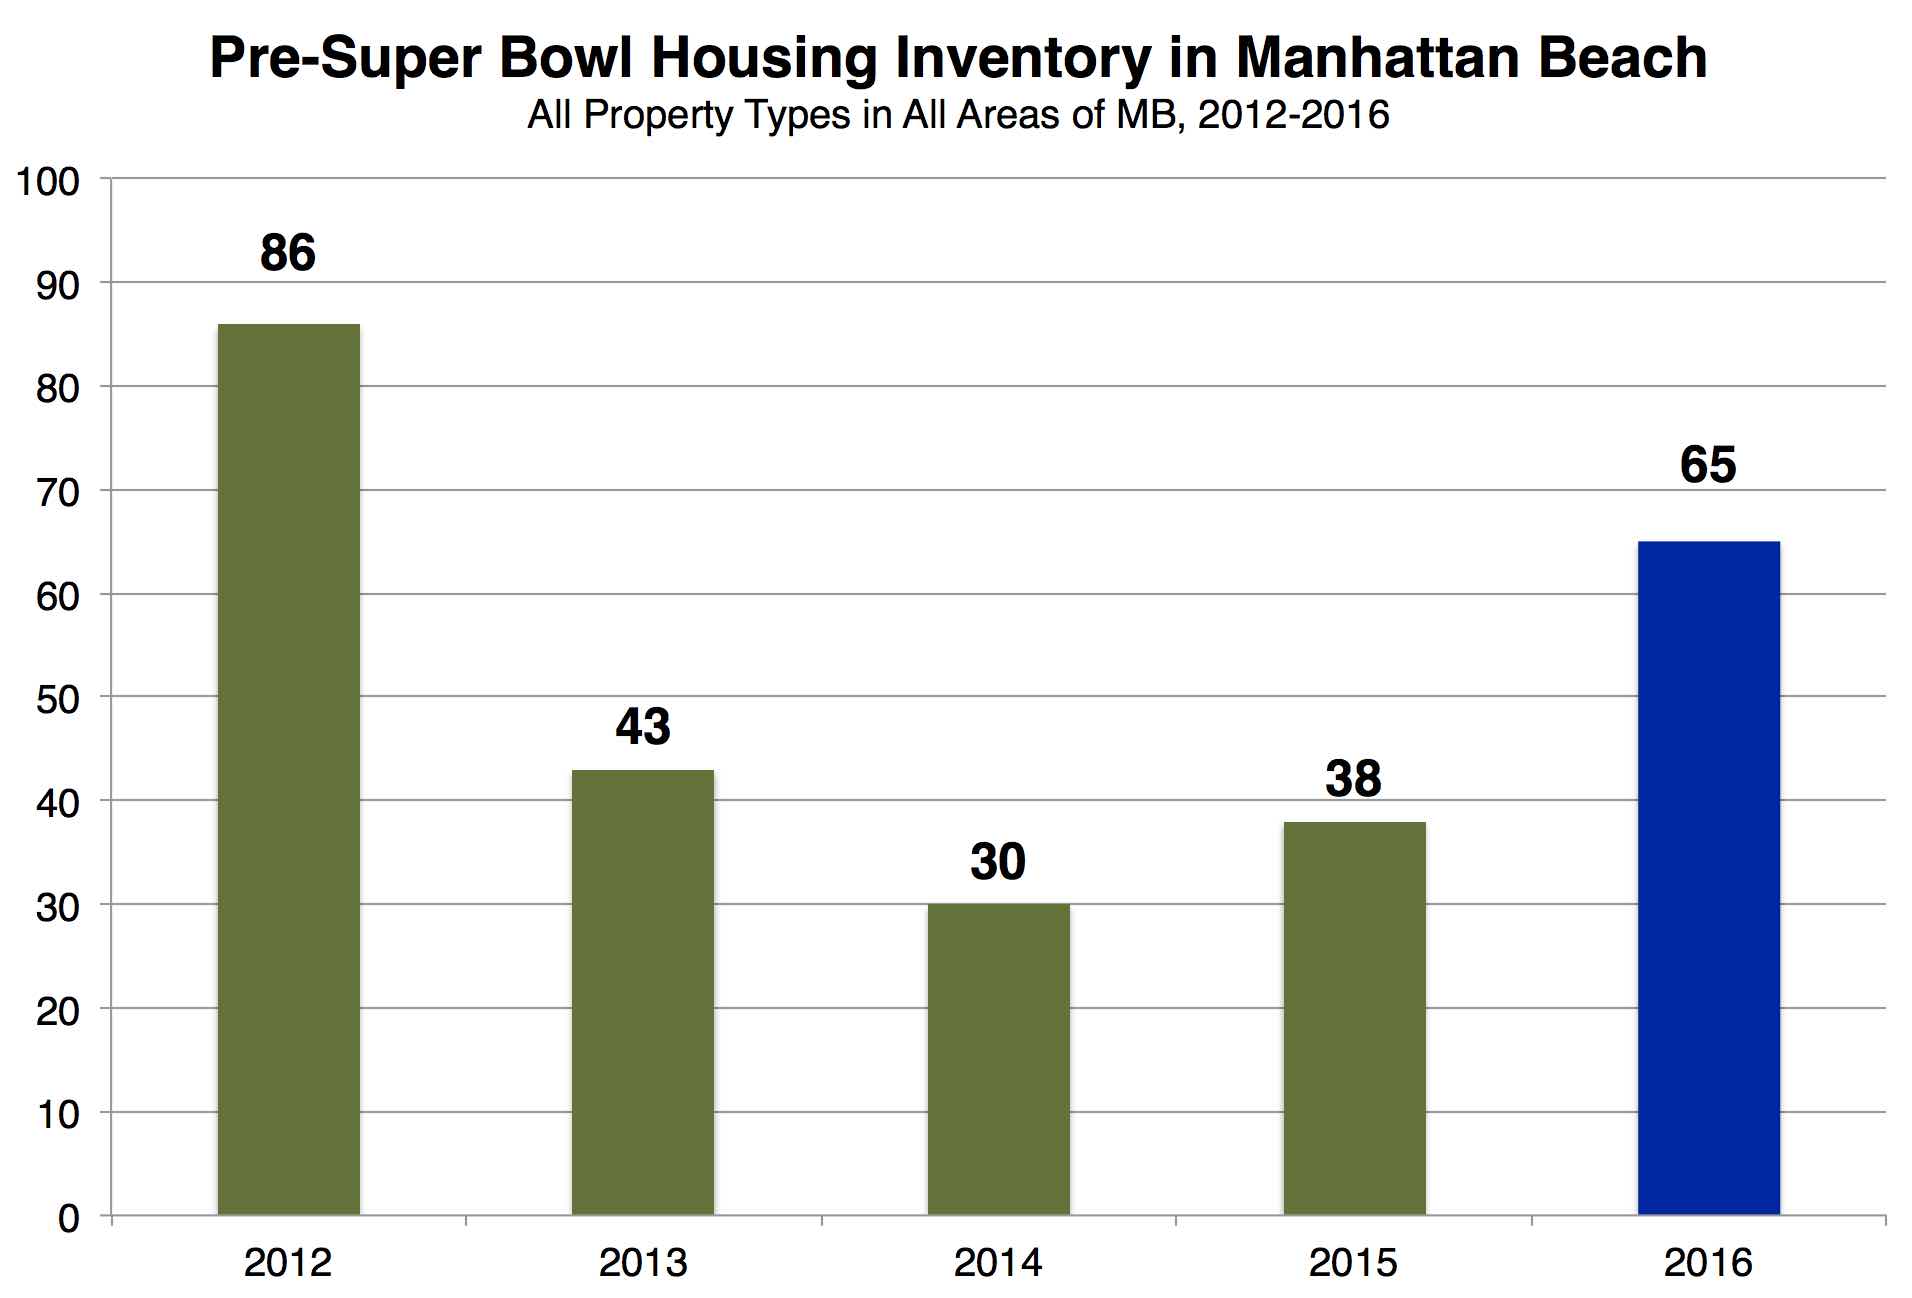
Look at pre-Super-Bowl inventory going back a few years in our chart here.
With 65 active listings as of February 1, Manhattan Beach buyers see 70% more choices than they had last year, and 50% more than in 2013.
It's all a far cry from 2012, when there were lots more: 86. How quickly things changed after that. (More below.)
Seeing higher inventory now is consistent with a finding we published here at MBC in January, in a post called "Inventory Higher in 2015; Prices, Too." Starting in Summer 2015, a little more inventory hung around each month for the balance of the year, and there were many more listings active at year-end than in recent years.
But last year, higher inventory and a lower number of sales did not result in lower prices. The median price went up 8%. (See that post and a late-2015 post, "Sales Down, Prices Up So Far in 2015.")
So you see, the bulls and bears (are there bears out there?) can use this same data to make any kind of prediction. If inventory rises, prices stop rising – er, unless prices rise anyway.
A point re: inventory that would need a separate look: What is sitting, exactly, and why?
Worth noting: Since we're looking at inventory from this time in 2012, note that 2012 was the year that things began to go bonkers in MB. By late March 2012, available homes were selling quickly in bidding wars. The return of multiple offers caused the first palpitations about what the heck was going on here... which has continued to go on here...and just became the expected "normal."
MBC's analysis at the time said inventory was down 39% year-over-year in March 2012 (see "South Bay Housing Inventory Down 1/3rd"). Yes, the rapid absorption process had begun, continuing without much change for 3+ years.
Now, Spring 2016, whatcha got?
Here's the rest of our local real estate market update report for the period ending 2/1/16:
- 65 active listings as of 2/11/16 (+3 from 1/15)
- 54 SFRs (-1)
- 11 THs (+4)
See the inventory list as of 2/1/16 here, or see the MB Dashboard for up-to-the-minute data.
Active listings by region of Manhattan Beach in this report:
- Tree Section: 14 actives (-2)
- Sand Section: 27 actives (+3)
- Hill Section: 7 actives (+1)
- East MB: 17 actives (same)
We're also providing a report on closed sales by region of MB.
Sales data, including PPSF for all properties, are organized by sub-region of Manhattan Beach.
Here's a link to the spreadsheet: "MB Pending/Sold as of 2/1/16."
Please see our blog disclaimer.
Listings presented above are supplied via the MLS and are brokered by a variety of agents and firms, not Dave Fratello or Edge Real Estate Agency, unless so stated with the listing. Images and links to properties above lead to a full MLS display of information, including home details, lot size, all photos, and listing broker and agent information and contact information.


