There's mixed news as we review data from the first half of 2018 in the Manhattan Beach real estate market.
 Start with the good: The Manhattan Beach median home price is a small tick higher now (in data through June 30, 2018), than it was at the start of the year.
As of Dec. 31, 2017: $2,349,000
As of…
There's mixed news as we review data from the first half of 2018 in the Manhattan Beach real estate market.
 Start with the good: The Manhattan Beach median home price is a small tick higher now (in data through June 30, 2018), than it was at the start of the year.
As of Dec. 31, 2017: $2,349,000
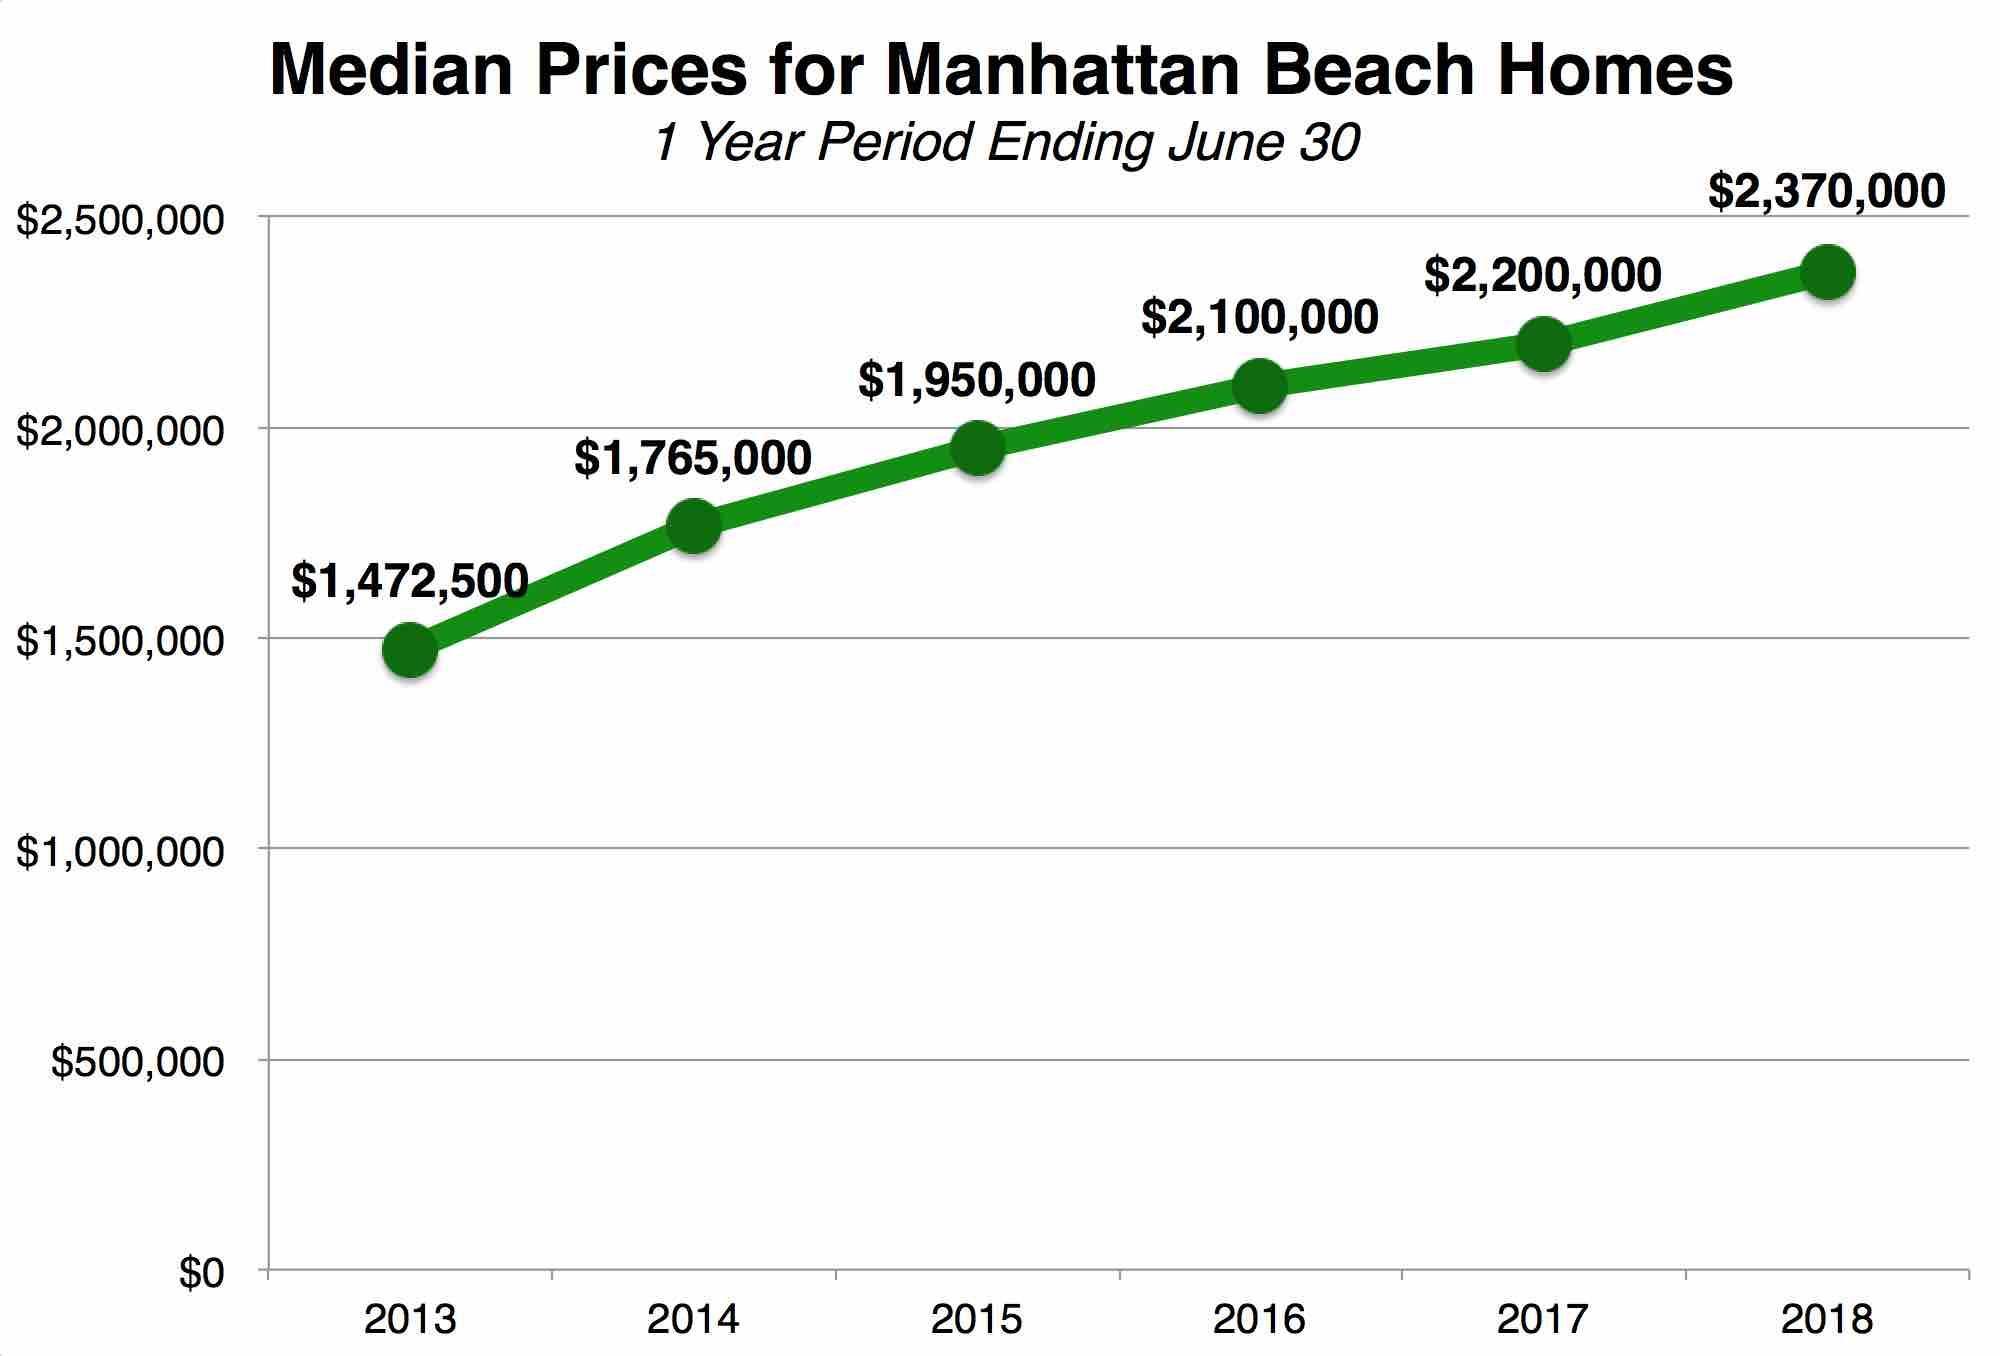
As of June 30, 2018: $2,370,000
Each of these median price figures covers a full 12-month span prior to the report date. So the Dec. 31, 2017, figure covers the whole of calendar year 2017, while the June 30, 2018, figure covers July 1, 2017-June 30, 2018.
That little bump of +$21K is a new high. It's almost 1% over the start-of-year figure. Check.
The rise in the median to $2,370,000 is also a $170,000 (+8%) rise over the June 30, 2017, figure of $2,200,000, when we did the same kind of midyear check-in as we're doing now. Last year, the rise was "only" $100,000 year-over-year. OK, check.
A $170K jump year-over-year at the midpoint is the largest since the $292K jump from midyear 2013-midyear 2014. Check.
But all of this bullish news is tempered a bit by some other points.
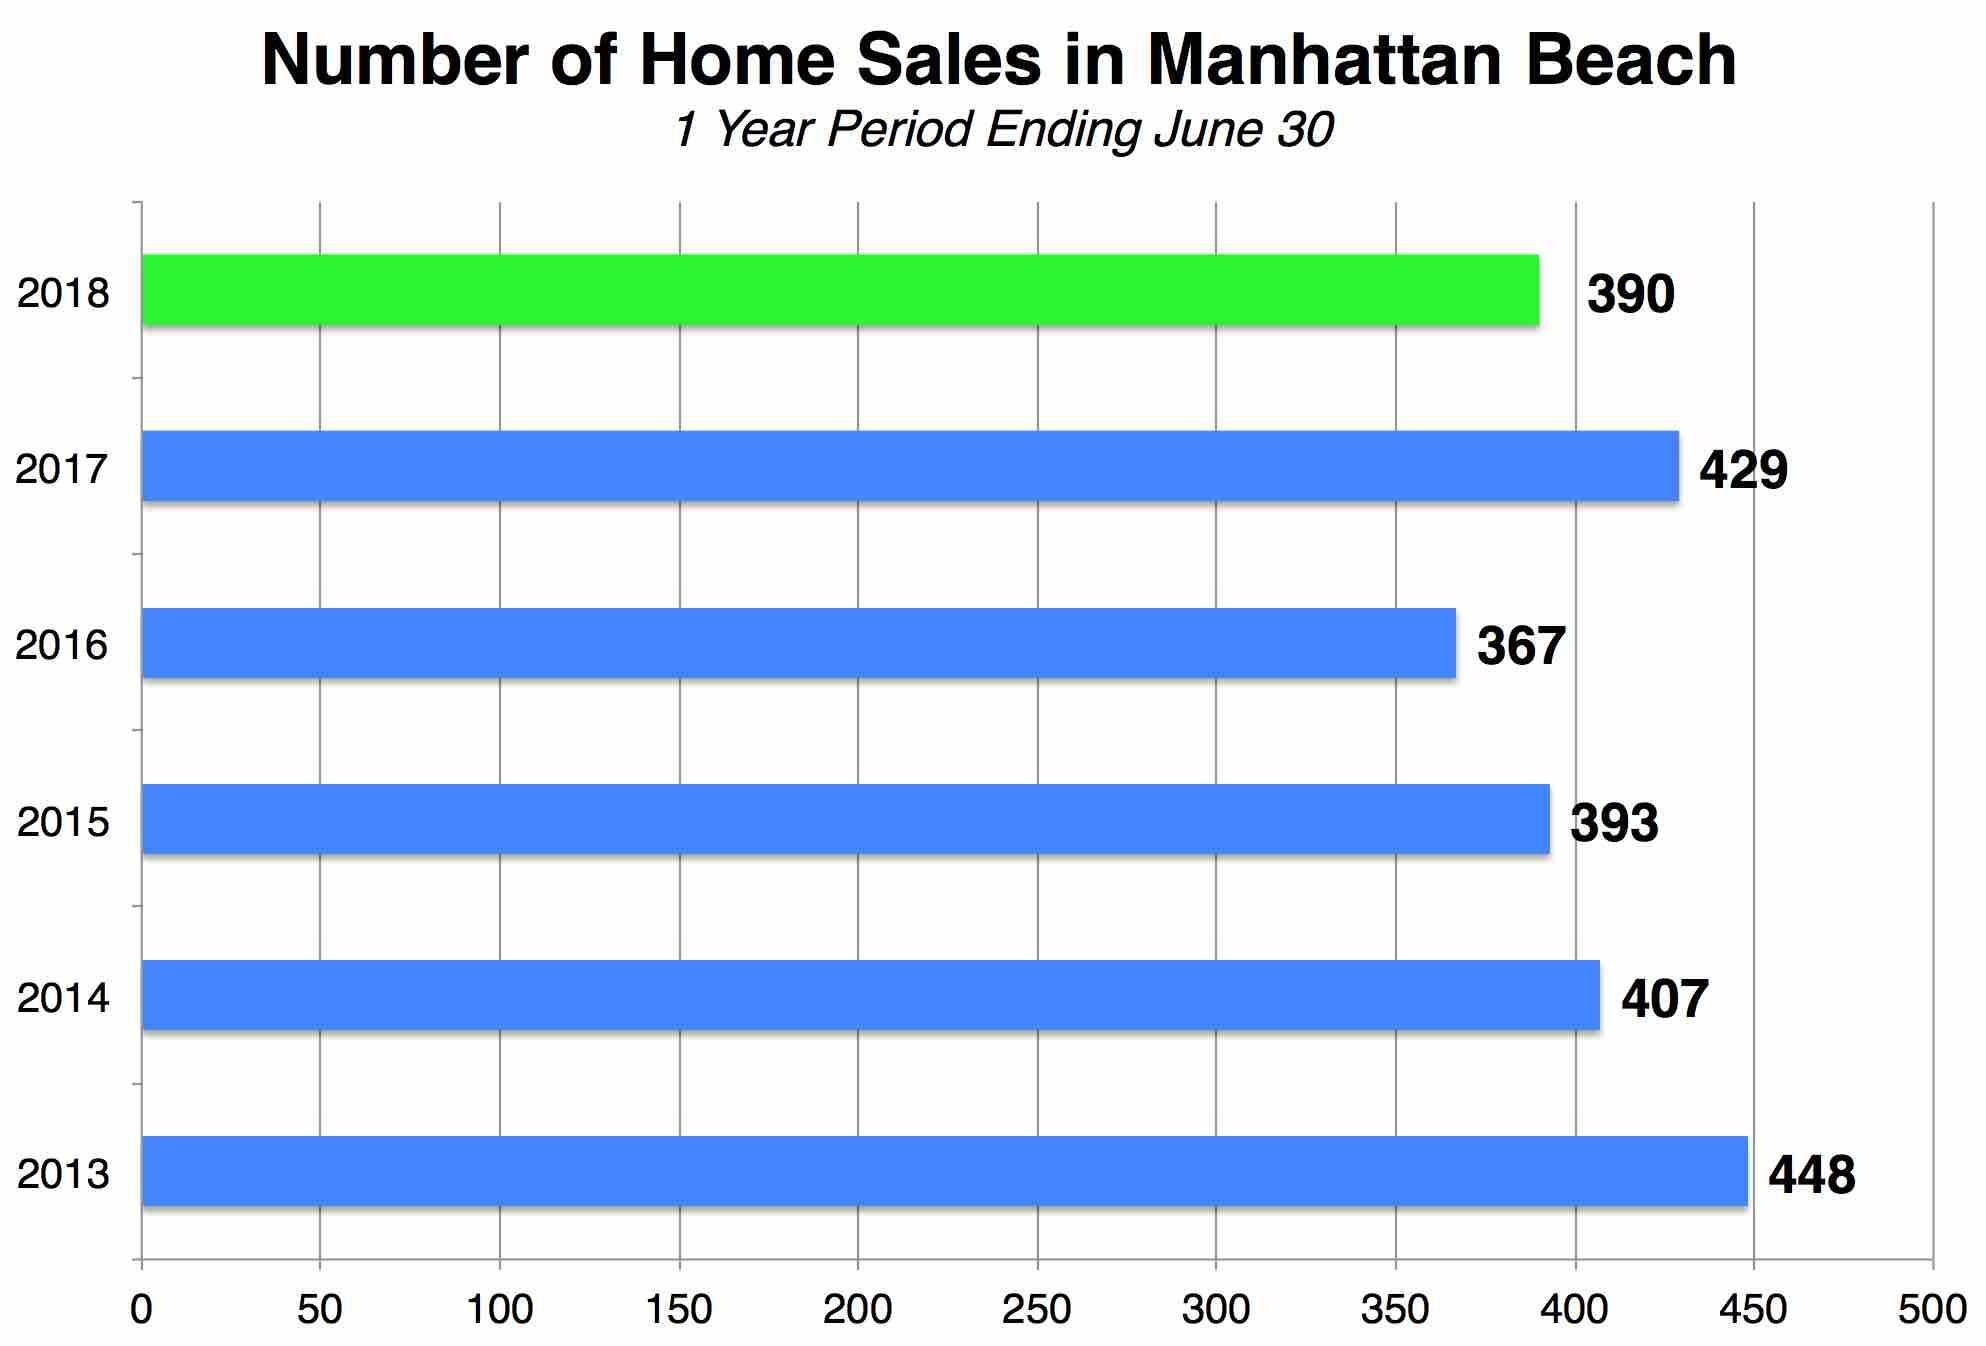
 First, the sales pace is down 9%, with 390 sales during this midyear-to-midyear span, compared to 429 in the prior year.
Higher prices, fewer sales... could those factors be related?
[Checks econ textbook.]
It's not that 390 sales is awful, but this is the second-lowest sales total from July-to-June of the past 6 years. (See last year's midyear check-in, "First Half '17 Bullish Again for Manhattan Beach.")
While the sales pace is slipping a bit, one can also note that the pace of median price rise is less dramatic now.
It had been quite a surprise, almost a shock, to see in our year-end data that the Manhattan Beach median price rose 13% from year-end 2016 to year-end 2017. (See "Manhattan Beach Median Price Soars 13% in '17.")
Now, just 6 months later, we're showing a year-over-year rise of 8%.
Again, it's not that an 8% rise is a poor performance. But 6 months later, we're no longer 13% higher than a year prior.
We took a little deeper look into the data, and found a couple of relevant points:
• Over the past 2 years, the highest number of sales in a recent 6-month period occurred from January-June last year (2017). Comparing only the sales pace for the first halves of 2017 and 2018, we actually saw a 14% drop in the number of sales from year to year. It's slower now. This is greater than the 9% drop when we look a full-year data.
• Over the past 2 years, the highest median price for a 6-month period occurred in the second half of 2017. The median is down just a bit (1%) in the most recent 6-month period. This is part of why we're not up 13% year-over-year in this midyear check-in.
There's no doubt about a couple of things:
• Prices are still higher, and
• The pace of sales is still strong.
And we've already noted that inventory is lower at this point in the year than in the prior two years.
So you don't see the makings of a sluggish market.
But neither is the market overheating. You could argue that the market is slightly calming, based on these data.
Obviously, the figures are open to both kinds of interpretation. We steered away from a headline like "Manhattan Beach Median Price Highest Ever" because we wanted to be sure you saw the undercurrents as well.
Please see our blog disclaimer.
Listings presented above are supplied via the MLS and are brokered by a variety of agents and firms, not Dave Fratello or Edge Real Estate Agency, unless so stated with the listing. Images and links to properties above lead to a full MLS display of information, including home details, lot size, all photos, and listing broker and agent information and contact information.

 Start with the good: The Manhattan Beach median home price is a small tick higher now (in data through June 30, 2018), than it was at the start of the year.
 First, the sales pace is down 9%, with 390 sales during this midyear-to-midyear span, compared to 429 in the prior year.