With the recent close of Q1, we'll check in on a few more data points from the Manhattan Beach real estate market.
Today we'll take a look at median home prices.
As you may recall, the local median home price saw a somewhat unexpected drop of 10.7% year-over-year in 2023, shifting down from $3.137M to $2.800M.
That happened amid drastic declines in the number of homes sold in 2023, seen in both year-over-year change and drops against the average number of sales over the 10 years prior. (See "How Far Home Sales Fell in SoCal in 2023.")
There is an argument to be made from the data that, with such a low sample size, just a few more sales here or there could have changed the outcome, resulting in less substantial price drops. But you have to go with the data you've got.
In a market update last week, we noted that this year generally has started out with more sales than last year.
However, when it comes to median prices, you may have seen a hint of a warning. We noted that, out of 60 closed sales from Jan. 1-March 31, there were 35 sales under $3M and 25 over $3M.
That's a deck potentially stacked to reduce median prices further. (The median price is the point at which half the homes sold went for higher prices, and half for lower prices. Therefore, if we keep stacking sales under $3M, you could see further median price declines.)
Here is a snapshot of 3 years' worth of data in our first chart:
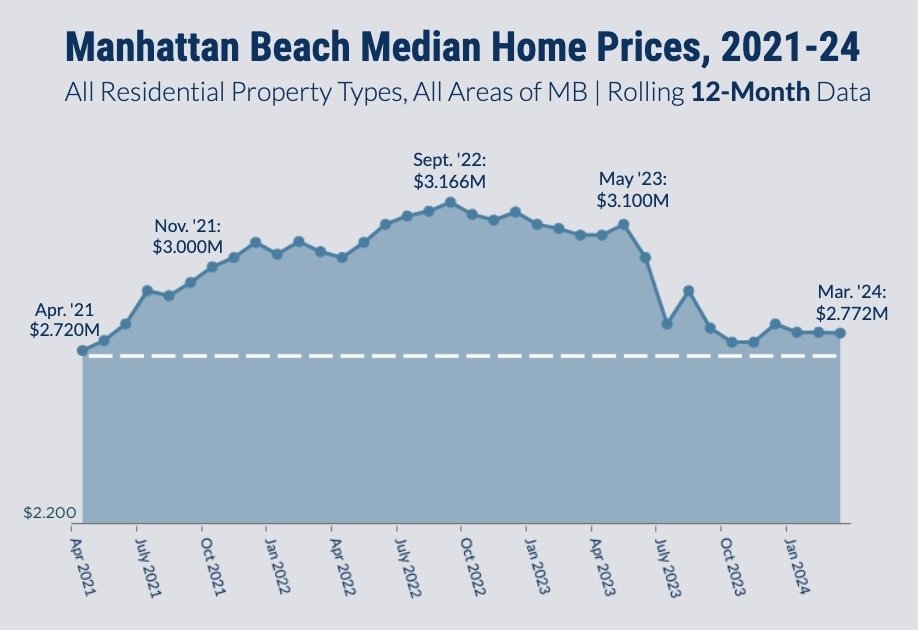
The good news is that the median price is actually pretty stable now, hovering at $2.772M, within 1% of 2023's year-end figure.
That flat, horizontal line for the past few months represents a pretty stable median price level. Is that a hint of a real estate "soft landing," after our market experienced a pandemic-fueled frenzy of home-buying and price increases?
Now, let's geek out a bit.
We always like to point out which data we are, and aren't, using.
We usually only print median prices based on a 12-month rolling set of data.
Out there in the chaos of media, you'll sometimes see one-month data compared against one other month's data. Maybe they'll take a snapshot of "SoCal home sales in March 2023" and compare those to March 2024, or even just February this year.
Shorter-period data are much "noisier" and open to misinterpretation. Especially in a market like Manhattan Beach, where 400 homes are sold in a typical year and just 253 were sold last year. You should not carve up a smallish data set like that!
You shouldn't. But what if we did?
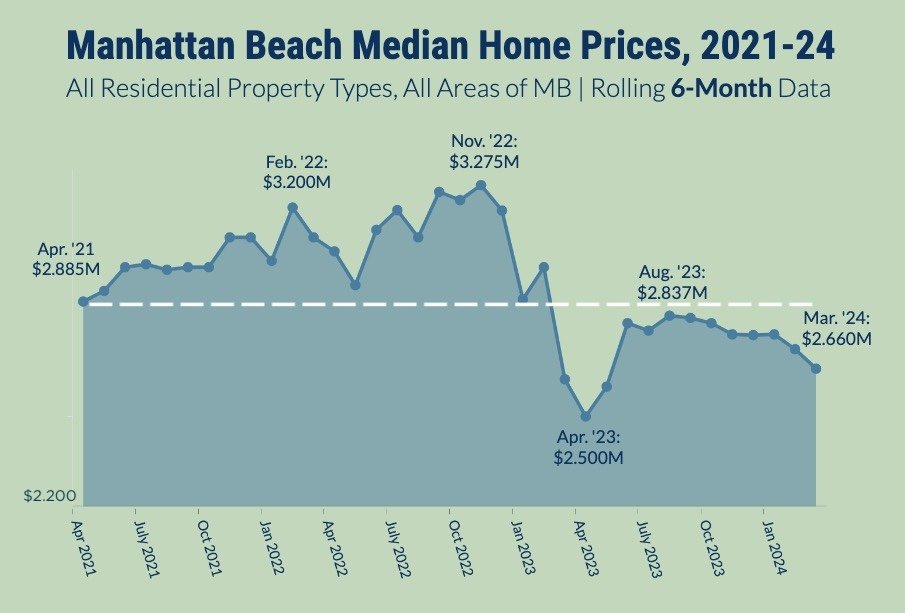
This one's a heckuva lot bumpier, isn't it?
We just used 6-month rolling totals.
As a result, the chart starts at a higher level ($2.885M), peaks higher ($3.200M and $3.275M) and dips horribly to $2.500M in April last year.
The most current numbers aren't as stable or as high as the 12-month data show. March is trending downward and sitting at $2.660M.
Whatever wacky stuff was going on with the mix of closings near March, April and May of 2023, you almost see a rebound or correction by June last year. (Now, you see why we use longer-term numbers?)
Just in case that data wasn't noisy enough for you, let's try another:
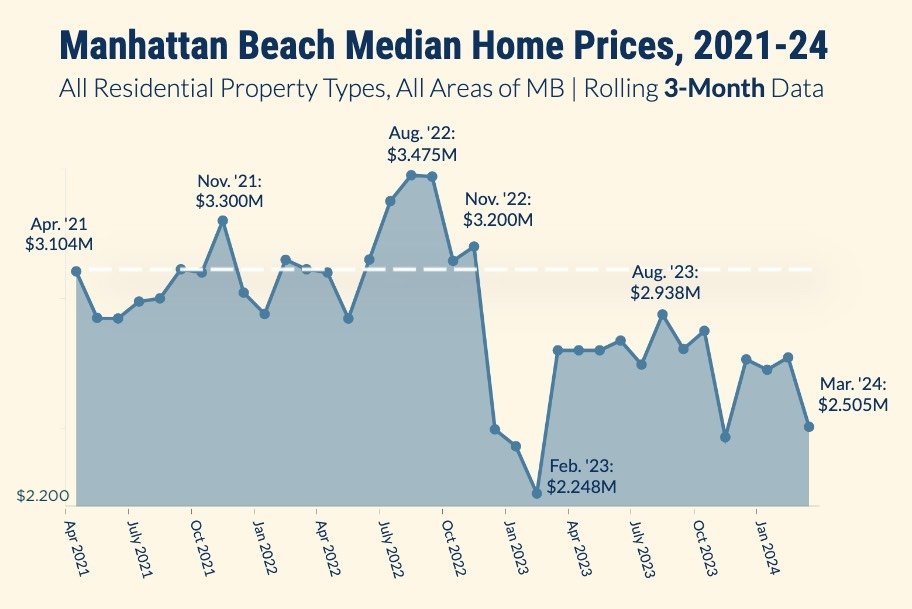
Why hello, Mr. Toad, may we try your wild ride?
Using 3-month rolling totals, we see that the chart starts much higher than the others ($3.104M) in April 2021, peaks much higher ($3.475M) and seems to show a popped bubble in February 2023 (median: $2.248M). And once again, using shorter-term data, the current median is quite a bit lower, at $2.505M.
As with the similar, scary dip in the 6-month data (which bottoms in April), this low, low point proves to be a false signal, as everything recovers by Spring 2023.
This one makes you ask: What does that February number represent?
Why, it represents sales that closed in some of the slowest months of the year: December, January and February. That's not a time when most families are making their new home transitions; it's a time for lot sales and fixers that come to market at sub-optimal times of year.
There might be little hints in the 3-month and 6-month data as to the prices that are in the mix for current sales activity. The numbers aren't useless. But they are drawn from datasets that are small, bumpy and noisy.
Later, we'll see if they also had tea leaves to read as to the direction of local prices.
Please see our blog disclaimer.
Listings presented above are supplied via the MLS and are brokered by a variety of agents and firms, not Dave Fratello or Edge Real Estate Agency, unless so stated with the listing. Images and links to properties above lead to a full MLS display of information, including home details, lot size, all photos, and listing broker and agent information and contact information.

